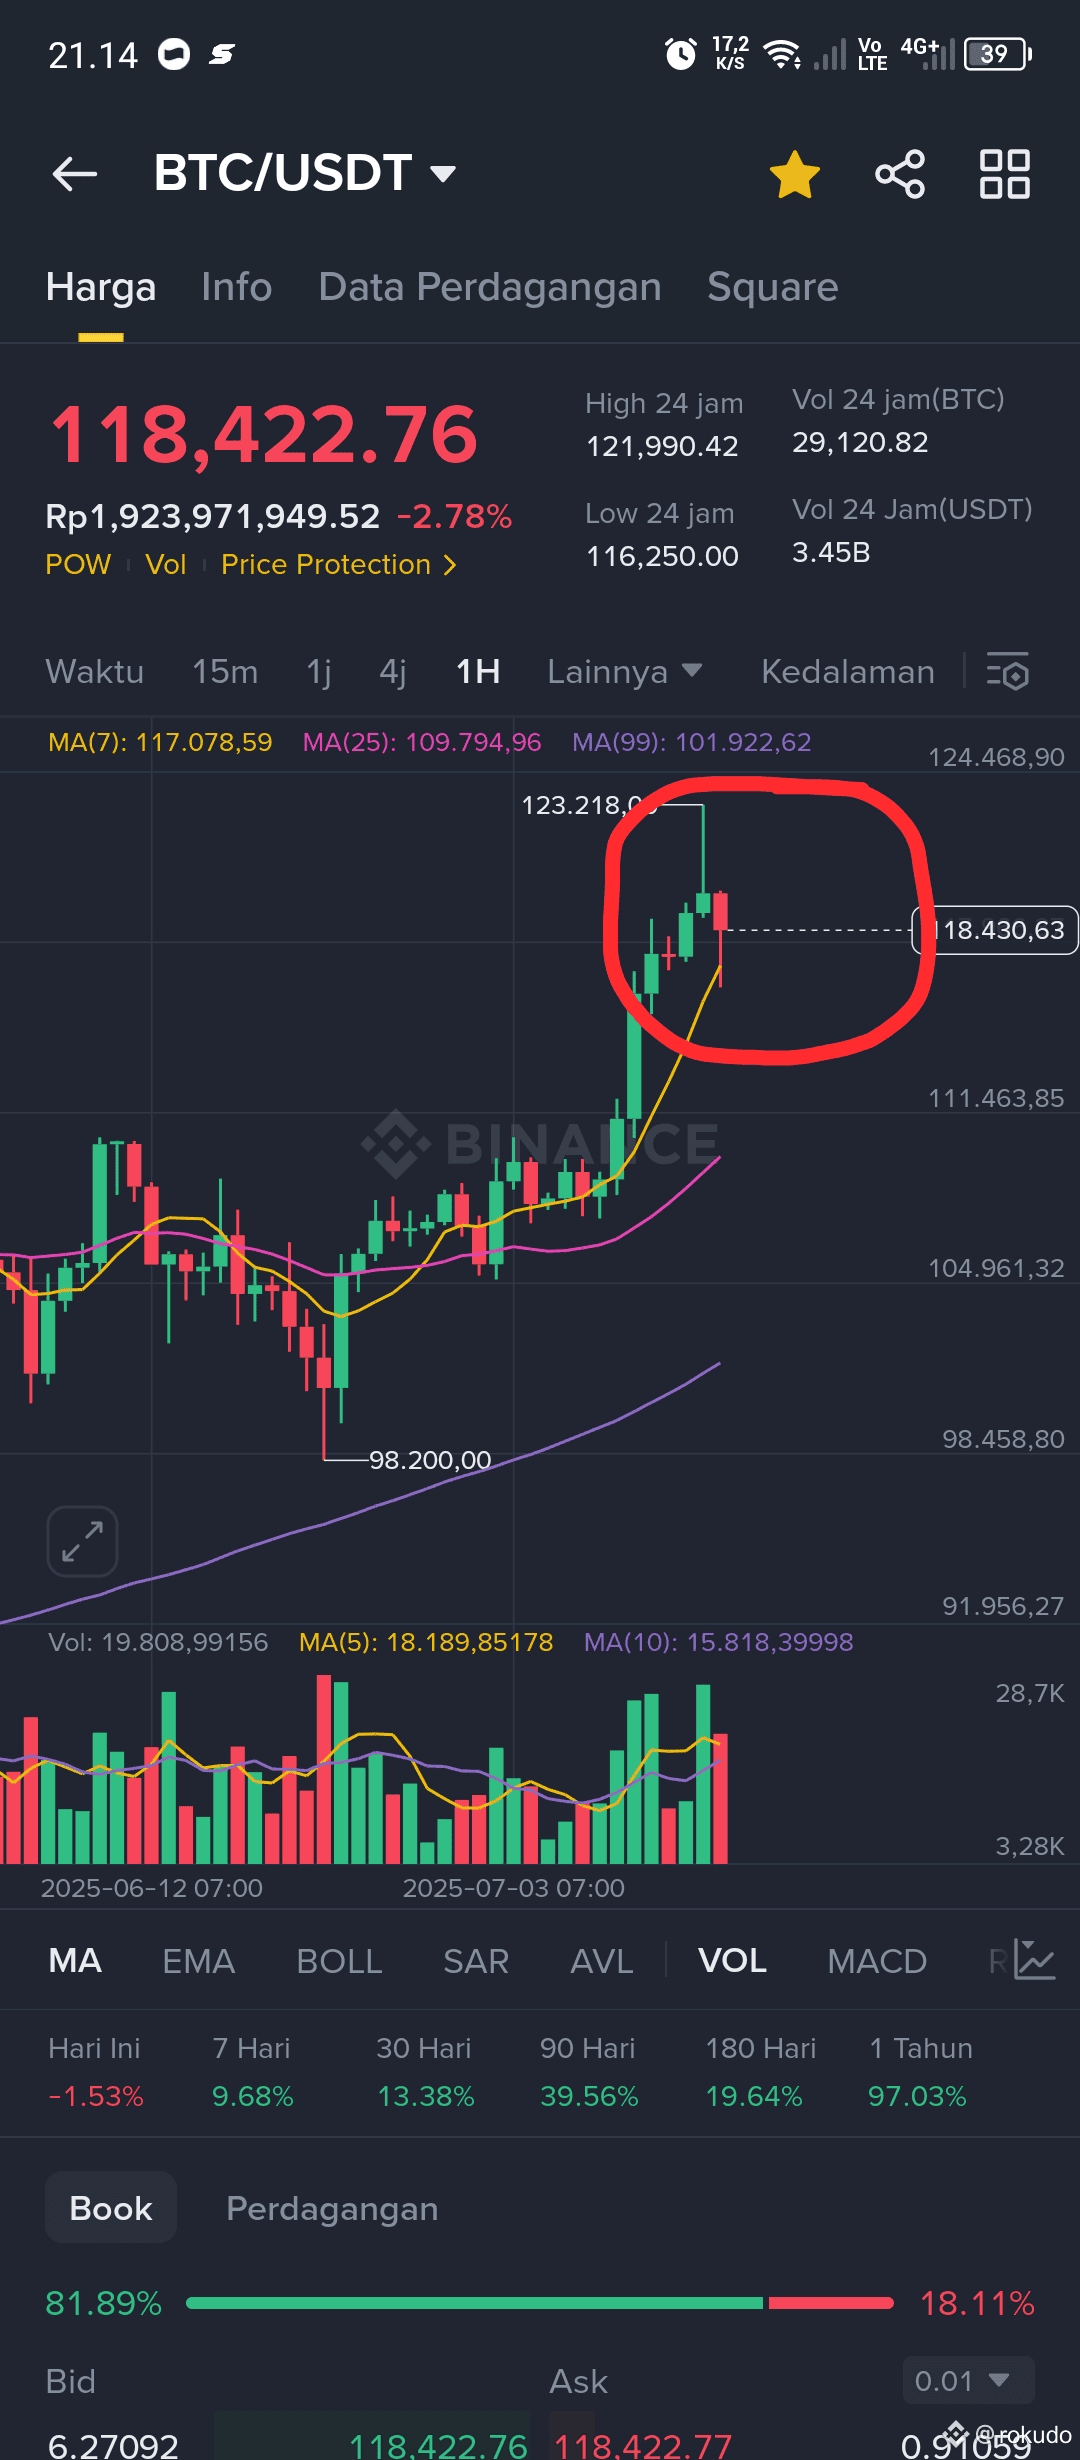
Bitcoin (BTC/USDT) has fallen 2.78% in the past 24 hours and is currently trading around 118,422 USDT. Despite briefly hitting a high of 123,218 USDT during the trading session,around 118,422 USDT. Despite briefly reaching a high of 123,218 USDT during today's trading session, selling pressure has returned to dominate.
BTC briefly reached a higher high at 123,218 USDT, but failed to maintain its high and closed below the previous candle.
A potential bearish engulfing pattern has formed on the H1 timeframe, which could trigger a further correctioBTC briefly reached a higher high at 123,218 USDT, but failed to maintain its high and closed below the previous candle.
A potential bearish engulfing pattern has formed on the H1 timeframe, which could trigger a correctioBTC briefly reached a higher high at 123,218 USDT, but failed to maintain its high and closed below the previous candle.
A potential bearish engulfing pattern has formed on the H1 timeframe, which could trigger a correctionBTC briefly made a higher high at 123,218 USDT, but failed to maintain its high and closed below the previous candle.
A potential bearish engulfing pattern has formed on the H1 timeframe, which could trigger a correction.. n.n.BTC briefly made a higher high at 123,218 USDT, but failed to maintain its high and closed below the previous candle.
A potential bearish engulfing pattern has formed on the H1 timeframe, which could trigger a correctioBTC briefly reached a higher high at 123,218 USDT, but failed to maintain the high and closed below the previous candle.
A potential bearish engulfing pattern has formed on the H1 timeframe, which could trigger a correction.n.BTC briefly reached a higher high at 123,218 USDT, but failed to maintain its high and closed below the previous candle.
A potential bearish engulfing pattern has formed on the H1 timeframe, which could trigger a correctioBTC briefly reached a higher high at 123,218 USDT, but failed to maintain its high and closed below the previous candle.
A potential bearish engulfing pattern has formed on the H1 timeframe, which could trigger a correction more in depth if confirmed with volume.
With a combination of short-term technical pressure and global sentiment remaining cautious, BTC has the potential to experience a correction towards the support area at 111,000–104,000 before continuing its upward trend.However, as long as BTC remains above the 99-day moving average (101,922 USDT) and the 98,200 support, the medium-term bullish structure remains valid.