Let me tell a story. At my worst, I lost 3 million in 3 days due to contracts liquidating, drowning in debt, almost losing my family, and nearly taking my own life. But the cryptocurrency world is so magical. By chance, I received guidance from a master. On a stormy night, I realized I had to start from scratch and became a full-time trader, dedicating myself to studying the craft. After thousands of days and nights of research and learning, I have now reaped thousands in returns! Although not like some who turn 10,000 into two small goals, I am very content and secure, dreaming of breaking 100 million in my account by the end of this year and earning more capital next year.
Now I will share my winning strategies and practical tips for trading cryptocurrency:
1. Insight into market sentiment and emotion: Trading volume is an important window for observing the market. When trading volume significantly increases without a price drop, it often signals that the market is about to stabilize; conversely, if the volume increases but the price fails to continue rising, it likely indicates the short-term trend is nearing its end. It is important to note that trading volume behaves differently during rising and falling phases. During an uptrend, trading volume should consistently and steadily increase. A sudden decrease in volume or an abnormal spike may signal the end of the uptrend. During a downtrend, if significant volume occurs at key levels, the downward trend is likely to continue.
2. Pay attention to key points: Key levels such as resistance, support, and trend lines are crucial indicators for market trends. Whenever the price approaches these levels, extra caution is necessary, and decisive action should be taken. I personally prefer using the golden ratio method to predict these key points, assisting my trading decisions.
3. Grasping the time window: Different time windows serve different purposes. One-minute charts are suitable for precisely finding entry and exit points; three-minute charts help monitor the trend after entry; half-hour or hourly charts are mainly used to observe changes in daily trends. By effectively utilizing these time windows, one can better and more accurately grasp market dynamics.
4. Properly handling stop losses: A stop loss means the end of a trade. One must not act blindly out of a desire to recover losses. Each new trade is a fresh start. Do not let previous operations affect current judgment and decision-making. Keeping calm and rational is crucial for better coping with market fluctuations.
5. Clever position management and trading strategies: This is a simple yet very effective method that beginners can easily grasp and profit from. We divide our positions into three equal parts. When the price successfully breaks above the 5-day moving average, we buy one part; if it continues to break above the 15-day moving average, we buy another part; if it further breaks above the 30-day moving average, we buy the last part. The entire process must strictly adhere to these rules. If the price breaks above the 5-day moving average but fails to challenge the 15-day moving average and instead drops, as long as it does not fall below the 5-day moving average, we maintain our position; if it drops below the 5-day moving average, we sell immediately. Similarly, when the price breaks above the 15-day moving average but cannot continue upward to break the 30-day moving average and falls back, as long as it does not fall below the 15-day moving average, we continue to hold; if it breaks below the 15-day moving average, we sell one part first. If the price breaks above the 30-day moving average and then falls back, we also operate according to the above method. When it comes to selling, the operation is reversed. When the price is high, once it drops below the 5-day moving average, we sell one part; if the price does not continue to drop, we keep the remaining position. If the price consecutively breaks below the 5-day, 15-day, and 30-day moving averages, we sell everything without hesitation, avoiding wishful thinking that the price will rise again. Although this method seems simple, the key lies in whether one can consistently stick to it.
Once bought, the rules of buying and selling are established and must be strictly followed to achieve relatively stable profits in this risk-filled cryptocurrency market.
How can I excel in cryptocurrency trading? Once a person enters the financial market, it is hard to turn back. If you are currently at a loss and still feel lost, but plan to continue treating cryptocurrency trading as a second career, you must understand 'candlestick strategy.' Understanding it will help you avoid many detours, based on personal experiences and feelings. I recommend saving it and reviewing it repeatedly!
What is a candlestick?
Candlestick charts are a must-learn subject for entering all secondary markets. We also refer to candlestick charts as candle charts. They originated during Japan's Tokugawa shogunate and were invented by Munehisa Homma. They were initially used to record rice market prices and were later introduced to stock and futures markets due to their unique and detailed representation. Through candlestick charts, we can observe market fluctuations, including opening prices, closing prices, highest prices, and lowest prices within a certain period.
What use is observing candlestick charts to me?
It can help you create better investment strategies and guide you in choosing the best times to buy and sell. For those who believe in holding coins, it is also necessary to understand. The trading interfaces of major exchanges are dominated by candlestick charts, and not understanding it can be embarrassing in the cryptocurrency world.
What information can be gained from observing candlestick charts?
Through candlestick charts, you can see price trends over specific periods (30 minutes, 1 hour, 1 day, 1 week...) including opening prices, closing prices, highest prices, and lowest prices. You can also see the intense battle history between bulls and bears.
Highlight
Composition of candlestick charts
The main components of a candlestick chart are two: bullish lines and bearish lines.
Each candlestick represents four prices of the day: highest price, lowest price, opening price, and closing price. The part between the opening and closing prices is drawn as a 'rectangular body,' and the highest and lowest prices are connected, forming the candlestick.
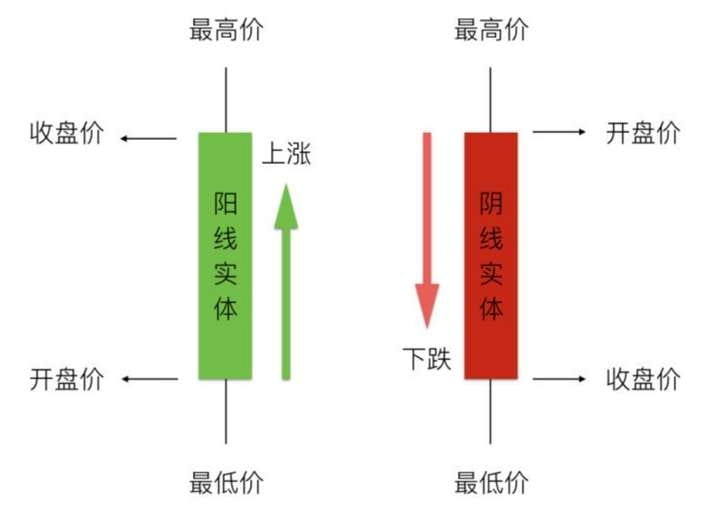
When the closing price is greater than the opening price, the body is green, indicating a price increase, which we call a bullish line.
When the closing price is lower than the opening price, the body is red, indicating a price drop, which we call a bearish line.
Most exchanges and analysis software in the cryptocurrency world use green to represent bullish lines and red to represent bearish lines. Generally, bullish lines represent the bull side (buying), while bearish lines represent the bear side (selling). The stronger side will be reflected in the candlestick chart. For example, if today the buying force is greater than the selling force, today's candlestick will be a bullish line (green bar). Conversely, if a bearish line (red bar) appears, it indicates that the selling force is stronger.
Note: In the Chinese stock market, bullish lines are red and bearish lines are green; in some representations, bullish lines may appear as solid bodies, while bearish lines may appear as hollow bodies.
What is a shadow line?
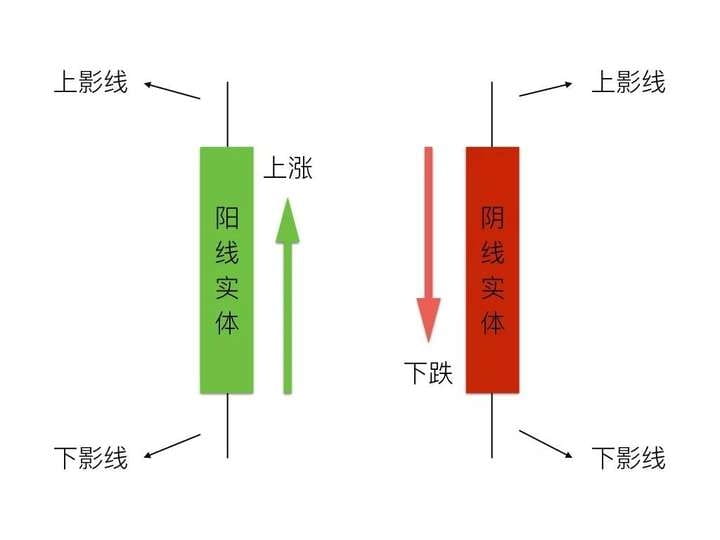
A shadow line is the thin line above and below the candlestick, indicating the difference between the day's highest and lowest prices and the closing price. The longer the shadow, the greater the resistance. A longer upper shadow indicates more resistance in rising prices, while a longer lower shadow indicates more resistance in falling prices. Regardless of whether it is a bearish or bullish line, the line extending upwards from the candlestick body is called the upper shadow, while the line extending downwards is called the lower shadow.
What is a battle between bulls and bears?
Bulls and bears are two factions. The bull side represents the green army, while the bear side represents the red army. Their viewpoints differ: bulls believe prices will rise, while bears believe prices will fall, leading to frequent battles. The bull green army consists of those who expect price increases and engage in buying, pushing prices up. The bear red army consists of those who expect price drops and engage in selling, pushing prices down.
In every time period, battles occur. If the bear red army wins, the price will drop, and the candlestick chart will display red. If the bull side gains a significant advantage, it indicates strength, and the candlestick's body will be larger. If the green side has weak resistance, it indicates that the resistance posed to the red side is too small, resulting in short shadow lines on the candlestick chart.
Common bearish candlestick combinations
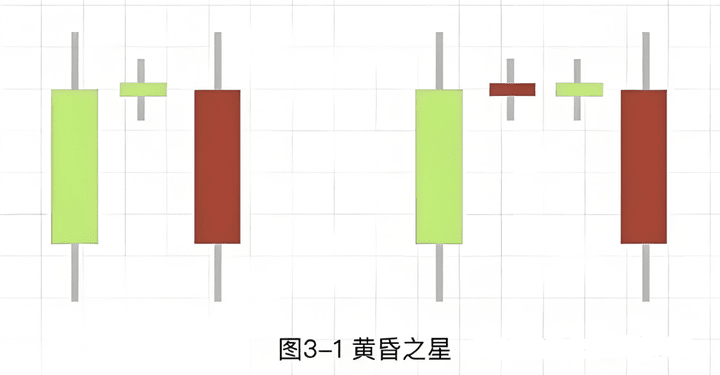
1. Evening Star
1. Technical characteristics
(1) Appearing in an uptrend;
(2) Composed of three candlesticks: the first is a bullish line, the second is a high open small bearish line, small bullish line, or doji, and the third is a bearish line;
(3) The third bearish line's body penetrates into the first bullish line's body.
2. Technical meaning
The evening star is a reversal signal indicating a market top, suggesting to sell, with a bearish outlook.
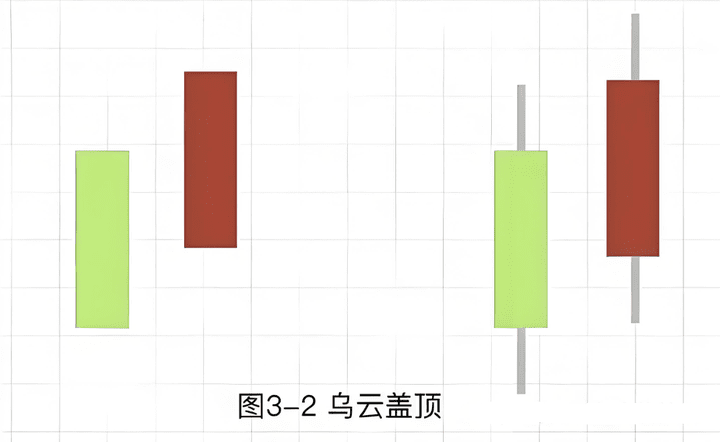
2. Cloud cover at the top
1. Technical characteristics
(1) Appearing in an uptrend;
(2) Composed of one bullish and one bearish candlestick;#交易策略误区
(3) First, a large bullish line appears, followed by a gap up large bearish line;
(4) The bearish line's body penetrates below half of the bullish line's body.
2. Technical meaning
Cloud cover at the top is a signal of market top, with a bearish outlook.
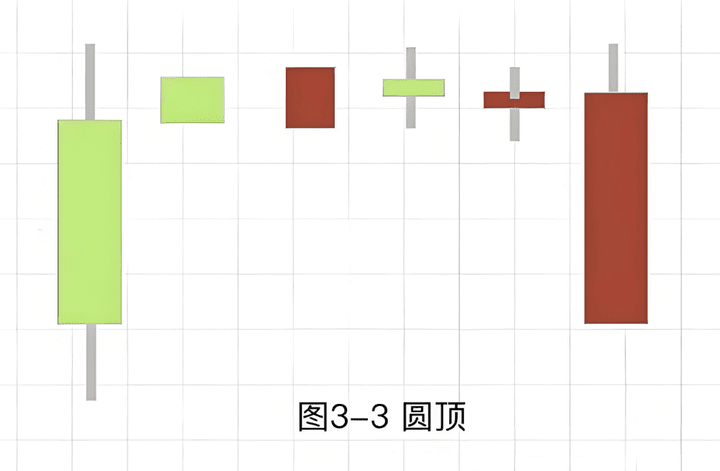
3. Rounded top
1. Technical characteristics
(1) Appearing during an uptrend or sideways consolidation;
(2) First, a large bullish line appears, followed by several small bearish and bullish lines forming a rounded top;
2. Technical meaning
A rounded top is a signal of market top, indicating a trend reversal, and the market outlook is bearish.
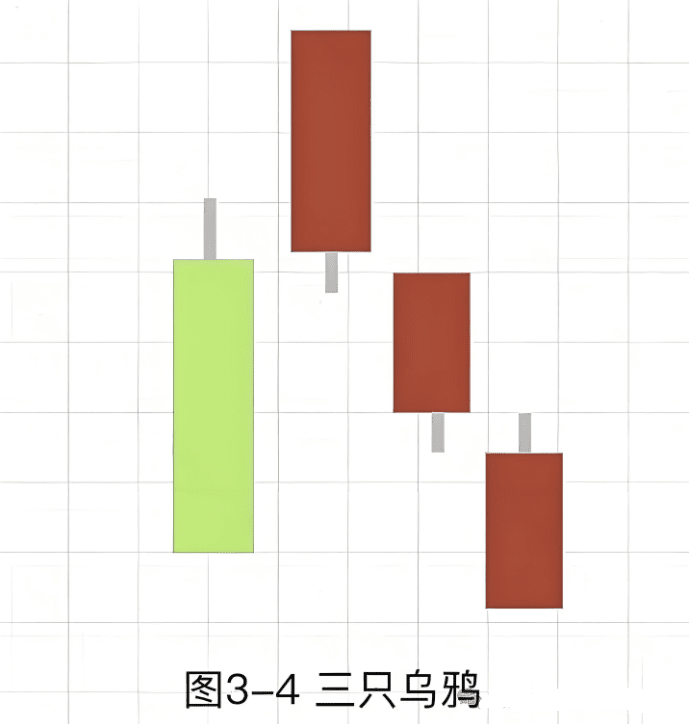
4. Three black crows
1. Technical characteristics
(1) Appearing in an uptrend;
(2) Composed of three large bearish lines with a gap up.
2. Technical meaning: Three black crows is a signal of market top, suggesting to sell, and the market outlook is bearish.
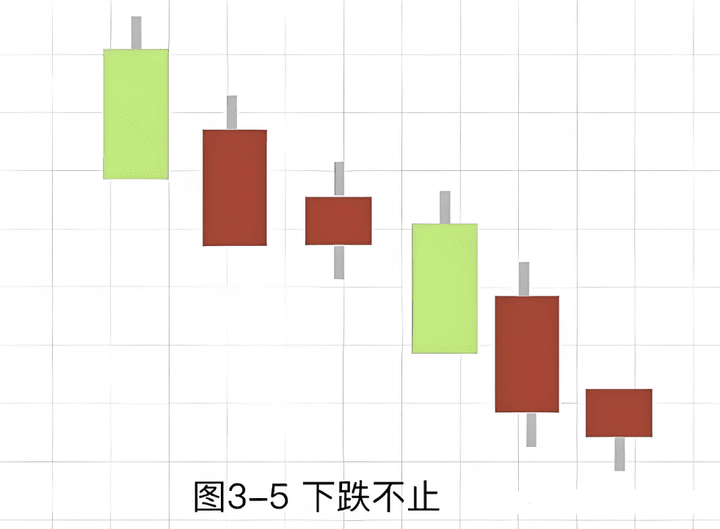
5. Continuous decline
1. Technical characteristics
(1) Appearing during a downtrend;
(2) Among numerous bearish lines, there are fewer small bullish lines;
(3) The entire candlestick arrangement is downward inclined.
2. Technical meaning: Continuous decline is not just a bearish signal, suggesting to sell.
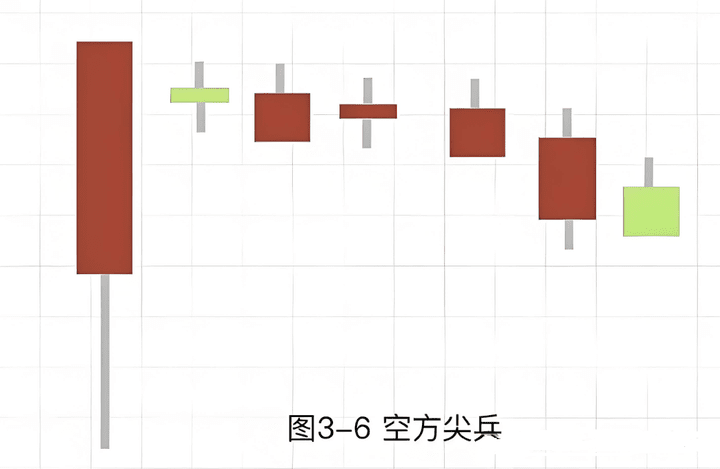
6. Bear's vanguard
1. Technical characteristics
(1) Appearing during a downtrend;
(2) Composed of several candlesticks;
(3) When a large bearish line is drawn, it leaves a long lower shadow;
(4) After a price rebound, it quickly drops below the lower shadow.
2. Technical meaning
The bear's vanguard is a selling signal, suggesting a bearish outlook.
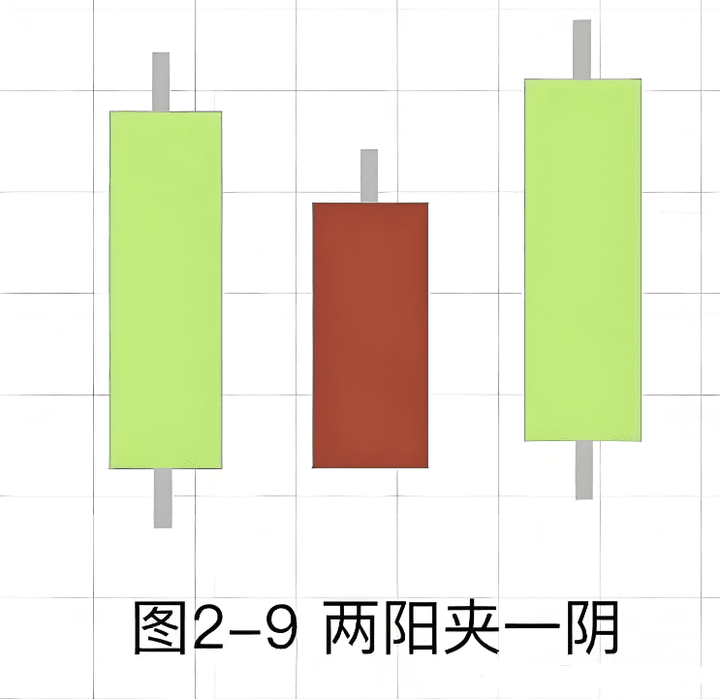
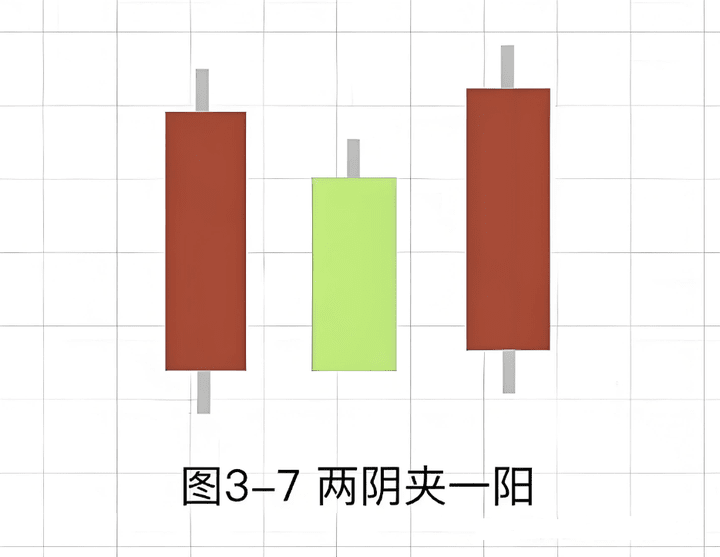
7. Two bearish lines sandwiching one bullish line
1. Technical characteristics
(1) It can appear in both uptrends and downtrends;
(2) Composed of two longer bearish lines and one shorter bullish line;
(3) A bullish line sandwiched between two bearish lines.
2. Technical meaning
(1) Appearing during an uptrend is a signal of market top, suggesting to sell;
(2) Two bearish lines sandwiching one bullish line often appear in a downtrend, rarely in an uptrend;
(3) Continuing to be bearish during a downtrend.
The martial arts secrets have already been given to you; whether you can become renowned in the martial world depends on yourself.
These methods should be saved and reviewed multiple times. If you find them useful, feel free to share them with more cryptocurrency traders around you. Follow me to learn more valuable content about cryptocurrency. After going through the rain, I am willing to provide an umbrella for the retail investors! Follow me, and together we will forge ahead in the world of cryptocurrency!
The above are insights from ten years of trading in cryptocurrency. I have experienced many ups and downs, and these are heartfelt words of enlightenment that I hope are useful to everyone. High-quality products come from banquet productions. In the cryptocurrency world, there are exceptional individuals, unique and independent, with a soulful path and skilled trading techniques!

