optimism and cautious considerations, driven by technical indicators, market trends, and fundamental developments. Here’s a concise summary based on the latest data: 📊
Follow :- @Lachakari_Crypto
Current Price and Market Context
• Price: ETH is trading around $3,001.44–$3,042.35 USD, with a 24-hour trading volume of $16.87–$35.77 billion and a market cap of approximately $361.45–$362.68 billion.
• Recent Performance: ETH has risen 1–3% in the last 24 hours and 20% over the past week, but it’s down 37.52% from its all-time high of $4,786 in November 2021. It’s showing bullish momentum, holding above $3,000 after a dip to $2,955.
Analyst Price Predictions for July 15, 2025
• Short-Term (July 2025):
• CoinGape: Predicts ETH trading between $2,600–$3,100, with a potential high of $3,495.65 and a low of $2,955.09. A bullish engulfing pattern on the weekly chart suggests strong buyer momentum, potentially revisiting $4,864 if the uptrend continues.
• 30rates.com: Forecasts a price of $2,937 on July 15, with a range of $2,731–$3,143, and expects growth to $3,410 by July 18.
• CoinCodex: Projects ETH at $3,325.19 by July 19 (+9.56% from current levels) and $3,323.79 by August 13 (+9.51%).
• CoinDCX: Sees ETH potentially hitting $2,940–$2,975 by July 13 if it breaks $2,800 resistance, supported by ETF inflows and the 20-day EMA at $2,520.
• Changelly: Estimates a July average of $3,234.38, with a range of $2,942.02–$3,526.73, but notes a possible 1.54% drop to ~$2,955 on July 15.
• Year-End 2025:
• Finder: A panel of 50 specialists predicts an average peak of $4,746, with ranges from $1,500 (John Hawkins) to $14,260. Most expect $2,000–$5,999.
• CoinPedia: Forecasts a high of $5,925, with a low of $2,917 and an average of $4,163, driven by ETF inflows and DeFi growth.
• InvestingHaven: Predicts $5,515, with a minimum of $1,669 and an average of $2,960, noting a potential cup-and-handle pattern signaling a breakout.
• Forbes: Estimates $5,770 by December, with some analysts (e.g., Standard Chartered) seeing $6,000 mid-year and $8,000 by 2026.
• Benzinga: Projects a range of $2,061–$6,000, averaging $4,054, citing DeFi and Layer-2 adoption.
• CCN: Suggests a conservative $2,600 by year-end, based on wave count analysis, but notes a potential rally.
• Traders Union: Predicts $3,045.7 by year-end, with a cautious outlook based on technical indicators.
Analyst Sentiment and Key Drivers
• Bullish Factors:
• ETF Inflows: Spot Ethereum ETFs, approved in July 2024, have seen $2–4.2 billion in net inflows, with BlackRock’s ETHA ETF holding $3.55 billion. This reflects strong institutional demand.
• Network Upgrades: The Dencun upgrade (March 2024) reduced fees and enhanced scalability, while the Pectra upgrade (May 2025) streamlines transactions and boosts security. Layer-1 zkEVM and Layer-2 solutions (e.g., Arbitrum, Optimism) support 10M TPS, reinforcing Ethereum’s DeFi dominance ($80 billion TVL).
• Institutional Adoption: SharpLink Gaming’s $500 million ETH purchase and corporate treasury strategies signal growing confidence. Analysts like Compass Point predict ETH outperforming Bitcoin due to eased regulations and DeFi/Layer-2 growth.
• Technical Indicators: Bullish signals include a rising 50-day and 200-day SMA, RSI at 58.38–76.00 (nearing overbought), and a bullish engulfing pattern. ETH is trading above the WMA 50 ($2,521.54) in a rising channel.
• Market Sentiment: Posts on X show mixed sentiment, with some analysts (e.g., @econoar, @jdorman81) noting ETH’s potential to rally as altcoin season begins, especially after bearish sentiment signaled a bottom.
• Bearish/Cautious Factors:
• Competition: Solana’s faster transactions and lower fees (potentially 100,000 TPS post-Firedancer upgrade) threaten Ethereum’s dominance.
• Validator Risks: 10x Research warns of validators exiting the network, potentially capping rallies.
• Macroeconomic Factors: Tariff-driven inflation and U.S. Treasury yield fluctuations (3.9–4.6% in April 2025) could pressure ETH prices, with a 1% yield rise historically cutting ETH by 28%.
• ETF Outflows: Despite inflows, Grayscale’s ETHE saw $2.5 billion in outflows, and pending SEC decisions on staking provisions add uncertainty.
• Volatility: ETH’s 6.1% monthly volatility and a 40% drop from its post-election high ($3,700) highlight risks.
Technical Analysis 🧐
• Support/Resistance: Key support is at $2,940–$2,955, with resistance at $3,183–$3,377. A break above $3,183 could target $3,495.65–$3,541.69, while a drop below $2,940 risks further declines to $2,145 (50% Fibonacci).
• Indicators: RSI (58.38–76.00) suggests overbought conditions, hinting at possible short-term corrections. MACD crossover and rising EMAs support bullish continuation.
• Chart Patterns: A bullish cup-and-handle pattern and a rising channel indicate potential for new highs, though consolidation is possible if $2,800 resistance holds.
Key Analyst Quotes
• Johnny G. (Lifted Initiative): Predicts $10,000 in 2025, comparing ETH to global assets like oil due to its DeFi role.
• Gracy Chen (Bitget CEO): Highlights Ethereum’s scalable Layer-2 solutions and institutional interest as growth drivers.
• Josh Fraser (Origin Protocol): Sees $9,000 in 2025, with ETH potentially flipping Bitcoin’s market cap long-term due to unlimited use cases.
• Compass Point: Expects ETH to outperform Bitcoin in 2025, with the ETH/BTC ratio (currently 0.037) rising due to DeFi and staking growth.
• 10x Research: Cautions that ETH may underperform Bitcoin if validators exit, predicting limited rallies without new catalysts.
Conclusion
Analysts are generally bullish on ETH for July 15, 2025, with short-term price targets ranging from $2,937–$3,541.69, driven by ETF inflows, network upgrades, and DeFi dominance. Year-end forecasts average $4,054–$5,925, with optimistic projections hitting $10,000–$14,260 if institutional adoption accelerates. However, risks include competition from Solana, validator exits, and macroeconomic pressures. Technical indicators lean bullish, but overbought signals suggest potential consolidation.
Data Points for the Chart 📊
• July 8, 2025: ~$2,531.68 (Coinbase, one week ago)
• July 9, 2025: ~$2,600 (CoinDCX, trading near this level)
• July 10, 2025: ~$2,628 (CoinDCX, reported trading value)
• July 11, 2025: ~$2,700 (interpolated, approaching $2,700–$2,800 resistance)
• July 12, 2025: ~$2,798 (CoinDCX, near daily high)
• July 13, 2025: ~$2,948.03 (Coinpedia, daily low)
• July 14, 2025: ~$3,046 (Coinedition, trading value)
• July 15, 2025: ~$3,042.35 (CoinDesk, current price)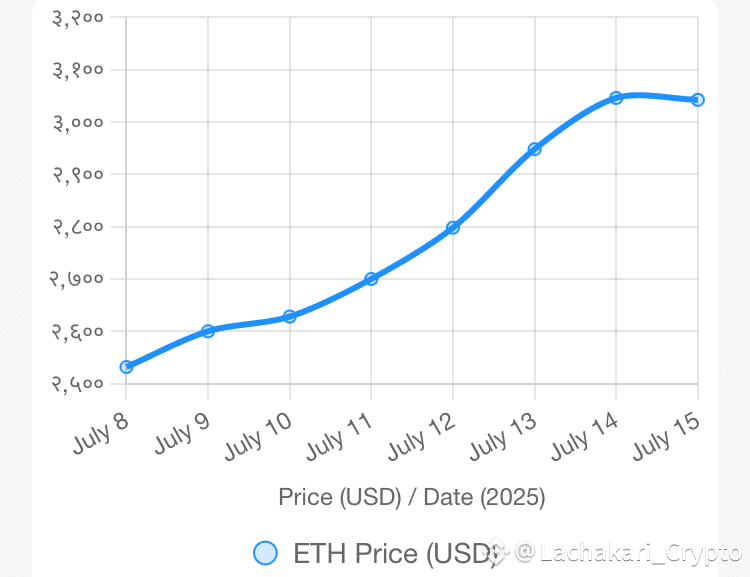
Chart Description
The line chart below tracks ETH’s daily closing prices in USD from July 8 to July 15, 2025, reflecting its upward trend and breakout above $3,000. The chart uses a clean design with a blue line for price movement, suitable for both light and dark themes, and includes key support ($2,940) and resistance ($3,183) levels noted in technical analyses.
For real-time updates, check @Lachakari_Crypto Would you like a chart of ETH’s recent price trends or a deeper dive into a specific analyst’s view?