On the path of investing in cryptocurrencies, whether you are a novice or an expert, you need to have your own principles! Every investment is an experience; seize every opportunity for growth. As the saying goes, 'I reflect on myself three times a day.' Only by learning to summarize and cultivate your principles can you avoid getting lost on the investment path and go further and stand taller.
A good teacher can guide you through confusion, helping you find the right path and clarify your direction; success is just around the corner! As an investor in the market, we must first learn to listen to the voice of the market and truly hear it. This lays the foundation for successful trading. At the same time, we must sense opportunities that most people cannot perceive and dig for potential trading opportunities.
Investment taboos: blindly following the herd effect will surely lead to destruction!
In fact, profit is not the ultimate goal of traders; it is a journey. There are no investors who only win and never lose. Try to focus your energy on pursuing trading techniques and enjoying the trading process rather than blindly pursuing profit results, which can be a good choice.
I went from losing 3 million to making over 40 million. This experience made me realize that trading is not just about accumulating wealth but also about mental growth. The cryptocurrency world is like a vast ocean; some sink here, while others are reborn. I hope my sharing can give you some inspiration and strength.
So how to excel in trading? Once a person enters the financial market, it is difficult to turn back. If you are currently at a loss and still feel confused, and plan to treat trading as a second career, you must understand the 'Bollinger Band method.' Understanding it thoroughly can help you avoid many detours. These are personal experiences and feelings; I suggest you save and ponder them repeatedly!
Without further ado, let's get straight to the point!
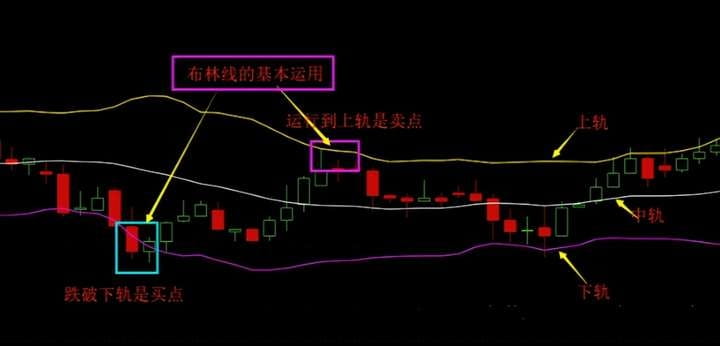
Methods of using Bollinger Bands
Concept: The Bollinger Bands (BOLL) are also known as the price channel lines, which indicate the trajectory of the currency price operating around a certain range. Technically, they have certain reference value for determining buying and selling points.
Two, principle: The movement of the currency price always fluctuates around a certain value pivot (such as the mean line or cost line) within a certain range. (Understanding Bollinger Bands: The currency price fluctuates up and down near the middle band.)
The composition: Bollinger Bands consist of three lines: Upper band ----- the yellow line of the BOLL; Middle band ------ the white line of the BOLL; Lower band ------- the purple line of the BOLL.
Three methods of applying Bollinger Bands: First, basic application; second, application of the opening direction of the three lines; third, the relationship between the K-line and the upper, middle, and lower Bollinger bands.
Basic application: Generally, the currency price will operate within the Bollinger channel range. When the price approaches the upper band, it is a strong resistance level and can generally be considered a selling point; when the price approaches the lower band, it is a strong support level and can generally be considered a buying point.
The core line of the Bollinger Bands is the middle band: the middle band is what we refer to as the value pivot. The upper and lower bands are derived from the middle band. Those who have studied statistics should be able to see from the calculation formula the effective reasons for the pressure of the upper Bollinger band and the support of the lower Bollinger band.
From the calculation formula, we can also see that the longer the period of the Bollinger Bands, the stronger the pressure of the upper band and the support of the lower band will be! The daily Bollinger Bands' middle band represents the 20-day moving average of the currency price, the weekly Bollinger Bands represent the 20-week moving average, and the monthly Bollinger Bands represent the 20-month moving average. How to understand this? 20 months is nearly 2 years, which means the cost of holding the currency for everyone over the past 2 years. The support of the monthly Bollinger Bands' lower band indicates the maximum tolerable downside space for holders over these two years. For bears to break this point, it indeed requires great courage!
Currently, we use the 20-day moving average of the currency price as the middle band of the BOLL. As for why, I am not very clear; it should be a result of practical verification. This indicator can be adjusted as long as it provides guidance for your operations; it doesn't matter how many days of moving averages you change it to. Our technical teaching uses the 20-day moving average as the standard Bollinger band.
Five, application:
The application of Bollinger Bands is extensive. We mainly discuss several aspects. Using only the BOLL line as a reference does not provide much guidance; combining it with the application of other indicators will yield much better results.
Basic usage A. Generally, when the price runs near the upper band, it is a time to sell, and when the price runs near the lower band, it is a time to buy.
B. The price can run along the upper Bollinger band for a long time, but the currency price cannot run below the lower Bollinger band for an extended period.
C. The longer the Bollinger Bands, the stronger the pressure of the upper band and support of the lower band. Monthly Bollinger Bands > Weekly Bollinger Bands > Daily Bollinger Bands.
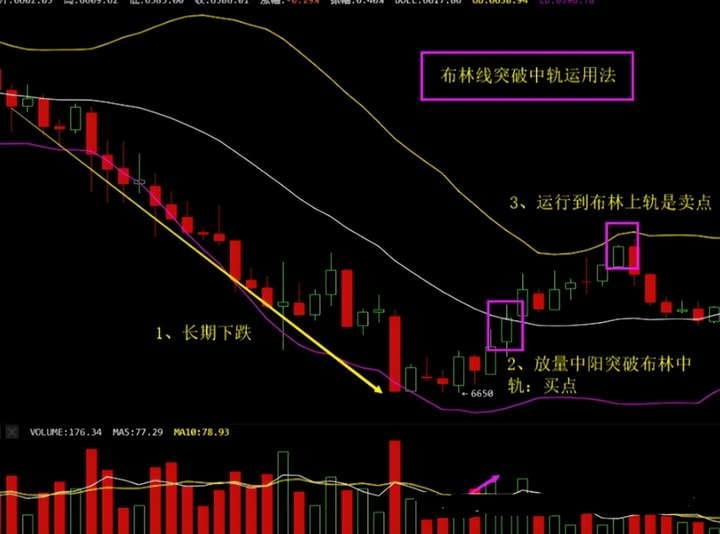
D. Generally speaking, the middle band is the dividing line for the strength of price movement. When the price is above the middle band, it indicates that the price is in a strong position; when the price is below the middle band, it indicates that the price is in a relatively weak position. A price that has been in a long-term decline suddenly breaks above the middle band with significant volume is a buying point. Similarly, a price that has been rising long-term and suddenly falls below the middle band with a large bearish candle is a selling point.
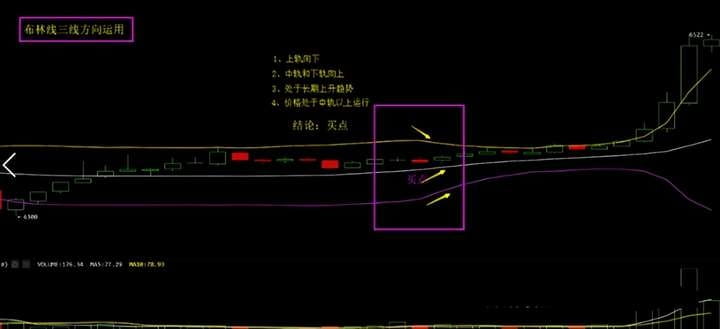
E. General application of the opening direction of the three Bollinger lines:
When the upper, middle, and lower Bollinger bands are moving upward simultaneously, it indicates very obvious strong characteristics of the price, and the price will continue to rise in the short term.
When all three bands are moving downward simultaneously, it indicates a very obvious weak price phase, and the price will continue to decline in the short term.
When the upper Bollinger band moves down while the middle and lower bands are still moving up, it indicates that the price is in a consolidation phase. If the price is in a long-term upward trend, it suggests a strong consolidation in the upward movement, and one can consider entering at a low point. If the price is in a long-term downward trend, it indicates a weak consolidation in the downward movement, focusing on observation and reducing positions.
When the upper, middle, and lower Bollinger bands are all moving horizontally, you need to assess the current price trend to determine the situation.
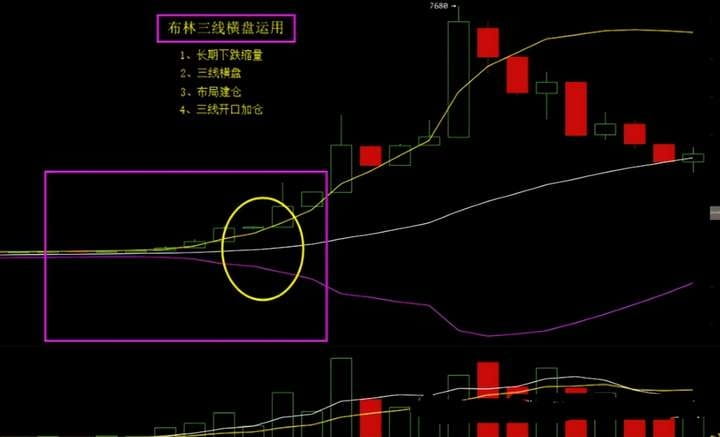
Long-term horizontal movement after a decline indicates that the price is at the bottom-building stage, and you can build positions in batches. Once the three lines begin to diverge, add to your position.
When the price has been in a slight upward trend, it indicates that the currency price is in a consolidation phase of an upward trend, and you can add positions.
When the price reaches a high level and appears in a slight downward trend with three lines horizontal, it indicates that it is in the consolidation phase of a downward trend, focusing on reducing positions. Once it diverges, sell decisively.
The relationship between the K-line and the upper, middle, and lower Bollinger bands.
When the K-line breaks upward from below the middle Bollinger band, it indicates that the strong characteristics of the currency price are beginning to appear. If the volume effectively expands, it is a good buying point.
When the K-line breaks upward from above the middle Bollinger band, it indicates that the strong characteristics of the currency price have been established, and the price can rise sharply in the short term.
When the K-line breaks upward beyond the upper Bollinger band, if the direction of all three Bollinger lines also moves upward, it indicates strong characteristics of the price. The price still has room for short-term upward movement. Only when the price begins to turn down should you consider selling.
Generally, breaking above the upper band faces significant pressure. If a large bearish candle drops back within the Bollinger upper band the next day, it indicates that the price is under great pressure. If the price has previously risen sharply, one should decisively exit. Examples are quite illustrative:
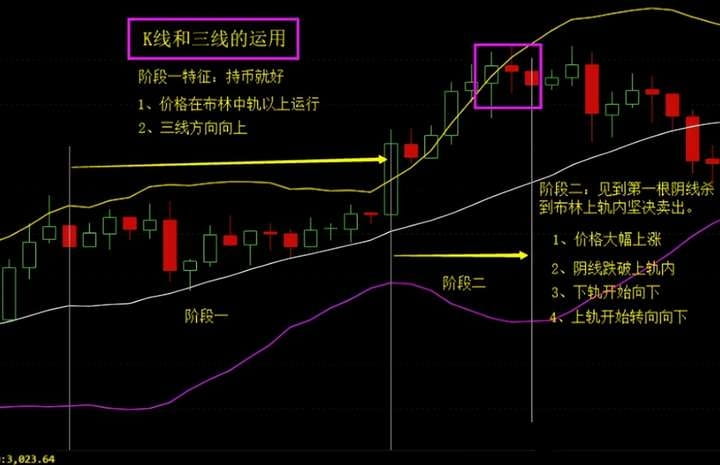
If the K-line falls back into the upper band and all three lines begin to move downward simultaneously, it indicates that the short-term price trend has ended and is about to experience a significant decline; exit decisively.
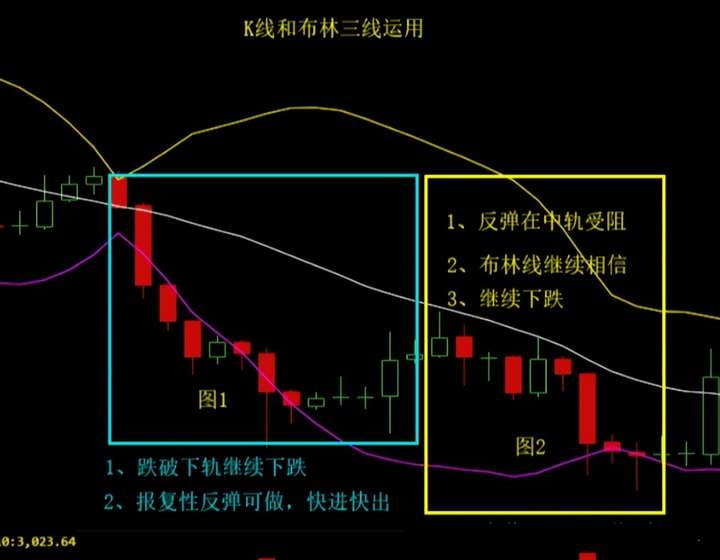
When the K-line breaks downward from above the middle Bollinger band, it indicates that the short-term strong price trend has ended, and a mid-term downward trend is forming. Timely stop-loss.
When the K-line breaks below the lower Bollinger band and continues downward, it indicates that a retaliatory rebound is about to occur. The rebound will continue to stay between the upper and lower bands. However, if the direction of all three lines continues downward, it means a new round of decline has begun, which is only suitable for trading oversold rebounds. If the direction of the Bollinger band shows signs of reversal after the retaliatory rebound, it indicates the start of a reversal trend.
When the K-line is consistently above the middle band and moves upward with the other bands, it indicates that the price is in a strong upward process. As long as the K-line does not fall below the middle band, continue to hold. Conversely, it indicates that the price is in a weak downward process. If the price does not break upward with volume beyond the middle band, do not intervene.
Lastly, pay attention! How to avoid anxiety in trading:
1. Before buying, you must do your research, including fundamentals, technical aspects, and the overall environment.
2. Develop a buying plan, including price, and consider building positions in 2 or 3 increments. Always use limit orders; otherwise, you will have to keep an eye on the K-line, which will make you anxious and mentally exhausted.
3. Develop a stop-loss and take-profit plan. You can use key points for take-profit and stop-loss or set fixed price fluctuations. Stop-loss and take-profit should also be set with limit orders to avoid staring at the market, as that will keep you anxious.
Buy and set your stop-loss and take-profit. Then do what you need to do; do not keep looking at the K-line. The more you look, the more anxious you become, the harder it is to control yourself, and the easier it is to make mistakes.
5. Properly manage your position; do not use high leverage.
If you feel anxious and uneasy, you should reflect on where the problem lies. Is it because you have no confidence in this coin, haven't researched thoroughly, or haven't set stop-loss and take-profit levels? Is it because your position is too heavy, you are eager to make money, or you lack patience? Then correct it in time to eliminate anxiety. If you really can't shake it off, then liquidate your position, stop trading, go out and have some fun, or return to life, and come back after some time.
Life must go through ups and downs to achieve great enlightenment! As long as you do not give up, the more you try, the closer you get to success. What is truly great in life is not having done something but dedicating your whole life to doing one thing.
Ten years of sharpening a sword; these heartfelt words are meant to guide those destined to find the right path and avoid detours. Trading is not a difficult task; I have never felt tired but instead find joy in it, just like those enthusiasts of late-night gaming—how could they say they are tired?
No matter how diligent a fisherman is, he will not go out to sea in a stormy season but will carefully protect his fishing boat. This season will eventually pass, and a sunny day will come! Pay attention to the banquet, which teaches you both fishing and how to fish. The door to the cryptocurrency world is always open; only by following the trend can you have a life in line with the trend. Save this in your heart!
