Bitcoin just reached a new all-time high (ATH) of $123,091 yesterday and is currently trading at $119,315. Some traders and analysts believe this is not the stopping point, but rather just the beginning of a much larger price increase.
Let's look at three simple reasons why some believe the bull run has really just begun.
Bitcoin still has plenty of room for growth
The chart below illustrates how Bitcoin typically rises over time. It resembles a large channel in which the price oscillates up and down.
Although $123,091 is a new record, Bitcoin is still near the bottom of that channel. Previously, when Bitcoin truly soared, it rose to the top of the channel, and that was when huge profits appeared.
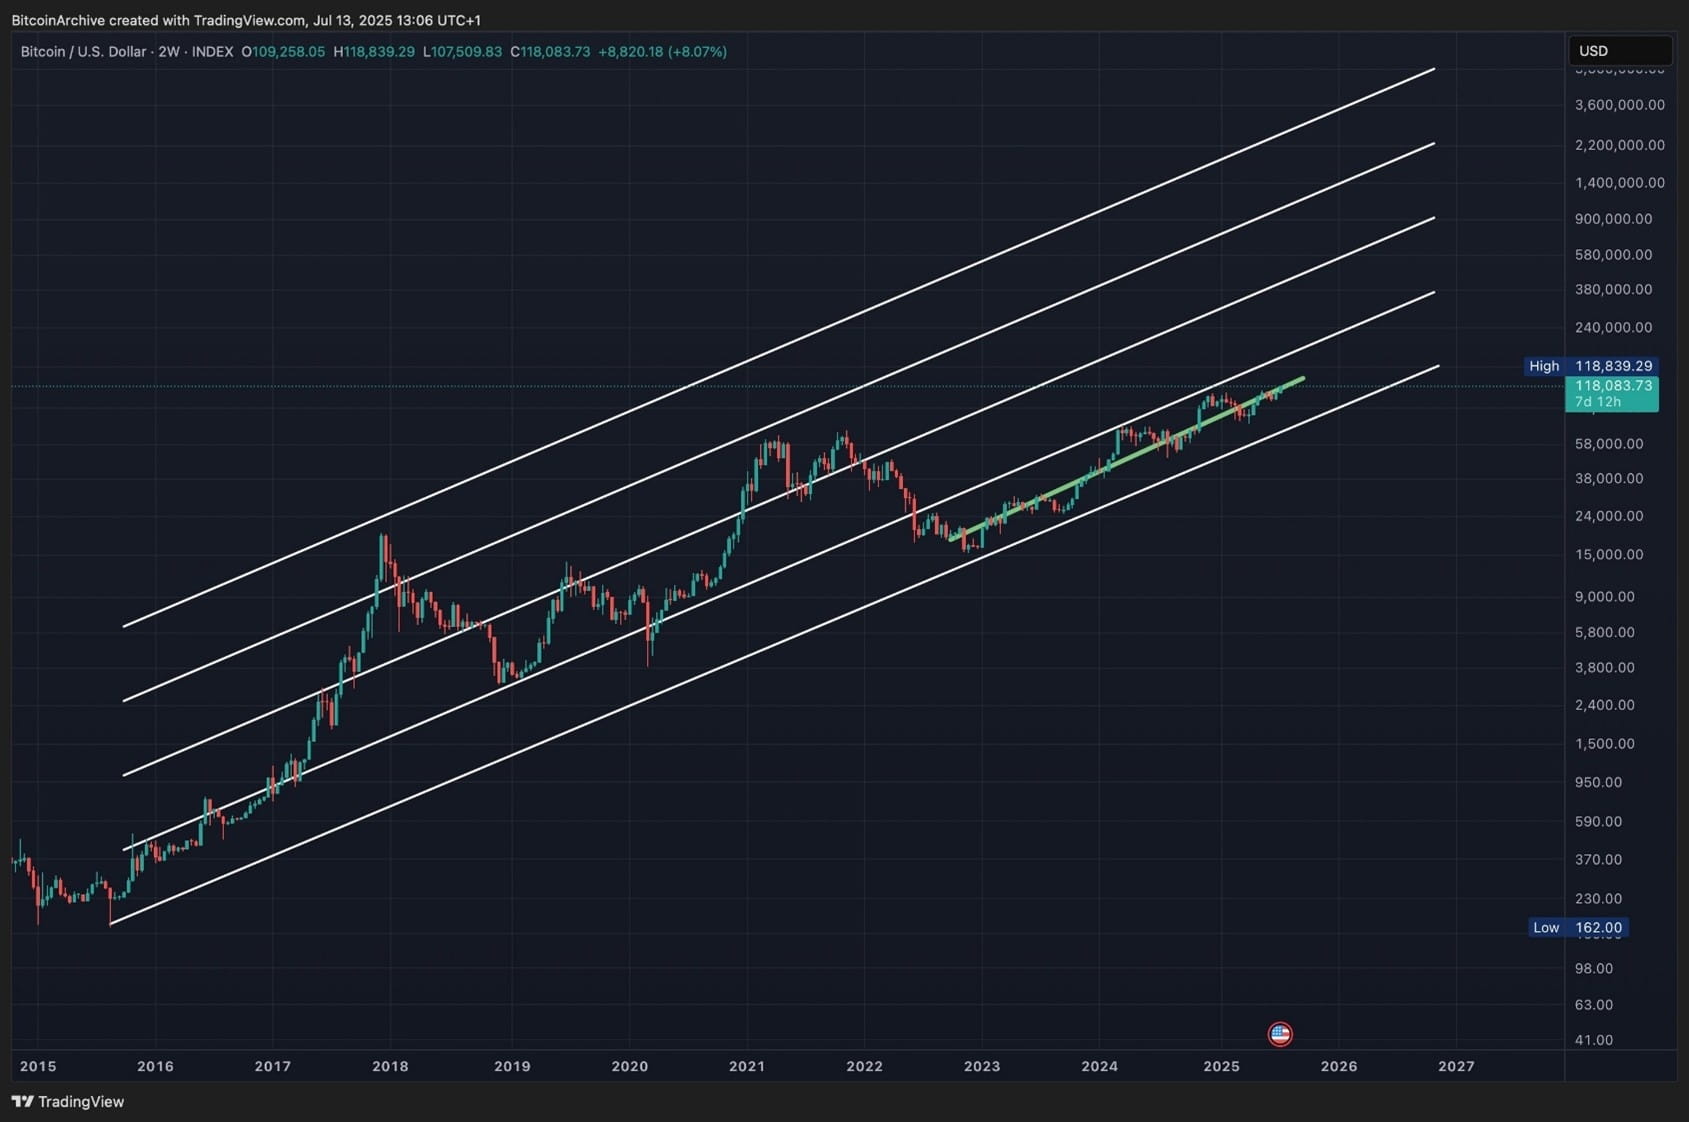
Therefore, although the price is currently at an all-time high, compared to Bitcoin's increases in previous bull cycles, we may still be at an early stage.
The RSI chart is signaling a bullish trend
The Relative Strength Index (RSI) is a tool that indicates whether the market is overbought or oversold.
When the RSI index rises too high, it often indicates that the coin is overbought — too many people are buying too quickly, and this usually signals an impending price correction.
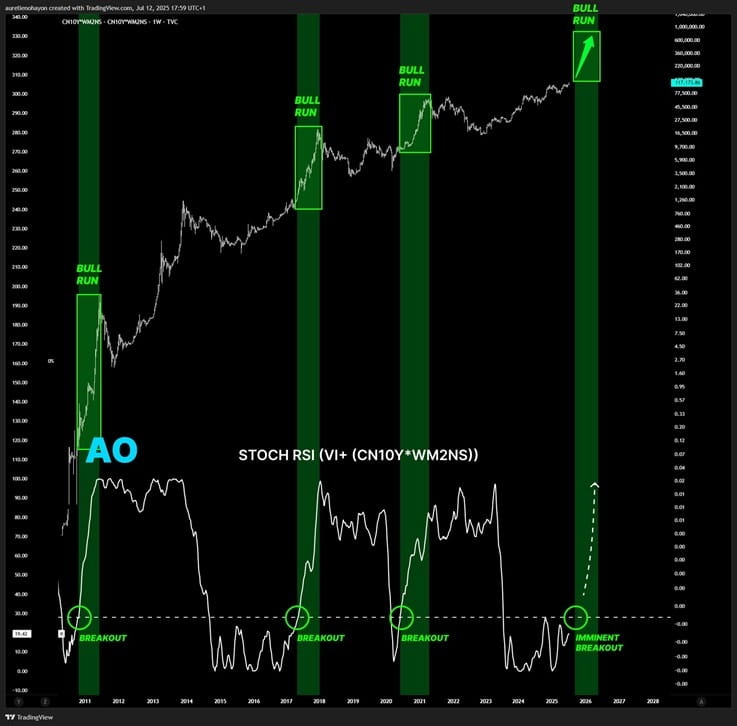
Currently, as Bitcoin analyst AO mentioned, Bitcoin's RSI is rising but is not yet too high. In fact, this slow and steady increase in RSI is very similar to what we witnessed before the 2021 bull run. This suggests that people are buying in, but this price increase may still have momentum. This is a positive sign.
Many traders could be liquidated when Bitcoin surpasses $120,000
Some traders are betting that Bitcoin's price will decrease. They use leverage, which means borrowing money to bet on the BTC price going down. If Bitcoin rises instead of falling, they will start to lose very quickly. If the price rises too high, they will be liquidated, meaning their trades will be forcibly closed. But the excitement doesn’t stop there.
When Short positions are liquidated, it creates a positive domino effect on Bitcoin's price, as the system will automatically buy BTC to compensate for the short positions.
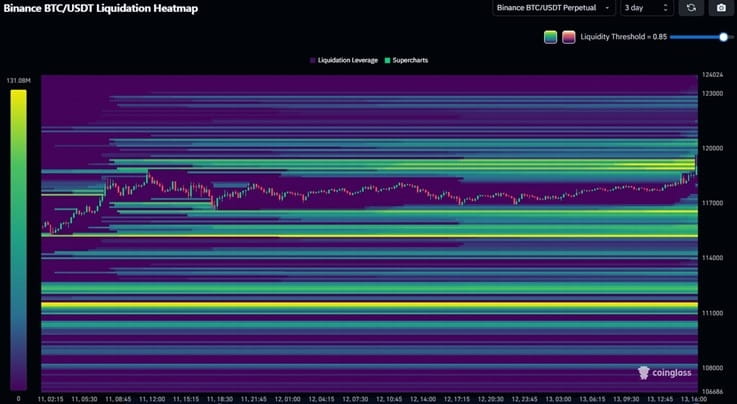
DaanCrypto, a well-known trader, shared a map showing that there are many traders in the $120,000 to $125,000 range. This area is filled with “liquidity clusters.”
If Bitcoin continues to rise, all of these traders could be “squeezed out.” This will create even more buying pressure, pushing the price even higher — like igniting a rocket.
The derivatives market is optimistic
Glassnode's report shows that open interest (OI) has risen to over $87 billion, while funding rate payments have nearly doubled, reaching $2.1 million — indicating increasing confidence from traders holding Long positions.
On the other hand, the options market is witnessing a controlled change, with OI soaring and skew turning negative — reflecting an increasingly optimistic sentiment among traders.
“The market is currently in a phase of high profits and strong confidence, supported by both the derivatives and spot trading markets,” Glassnode noted. However, despite the outlook still leaning towards an upward trend, the increased leverage poses a risk of significant price volatility.
Alongside changes in spot and derivatives trading volumes, demand for Bitcoin from accumulation wallets — meaning wallets that have never spent any BTC — has also reached a new all-time high.
These wallets have accumulated about 248,000 BTC in July — equivalent to about $29.5 billion, significantly higher than the monthly average of 164,000 BTC, indicating strong buying activity, according to data from CryptoQuant.
“Although BTC continuously breaks historical peaks, some long-term investors are quietly accumulating from now on,” wrote analyst Darkfrost from CryptoQuant on Monday.
This strong demand also coincides with a wave of money flowing into Bitcoin spot ETF funds, which recorded up to $2.7 billion in capital inflow last week.
Has the price of Bitcoin peaked?
The current sentiment may lead many to think that the price has peaked — after all, $123,091 is a huge number. But when looking at the charts and technical signals, nothing shows signs of “topping out.”
The large price channel still has room to increase further. The RSI is rising, but has not yet entered the hot zone. Meanwhile, there is still “fuel” above in the form of liquidation orders. All of this signals that the current price increase is not yet over. In fact, the strongest breakout may still be ahead.
The BTC price chart reflects the same. According to the Fibonacci extension indicator based on the trend, BTC is currently trading below the important resistance level at $121,623. Once this level is breached, the possibility of the price continuing to reach the $136,000 area is completely feasible.
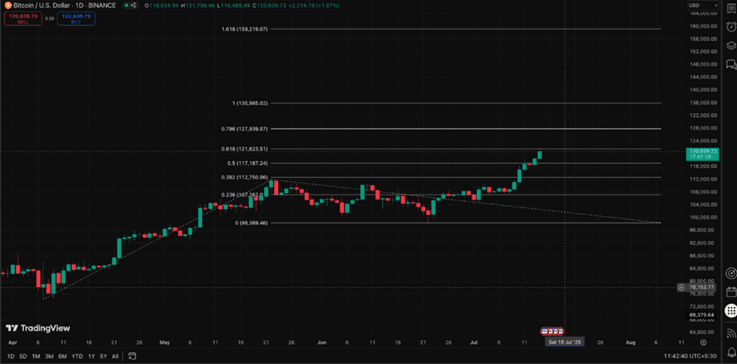
A more optimistic target would be $160,000, which also seems feasible based on the chart above. However, a drop below $112,000 would invalidate the upward trend.
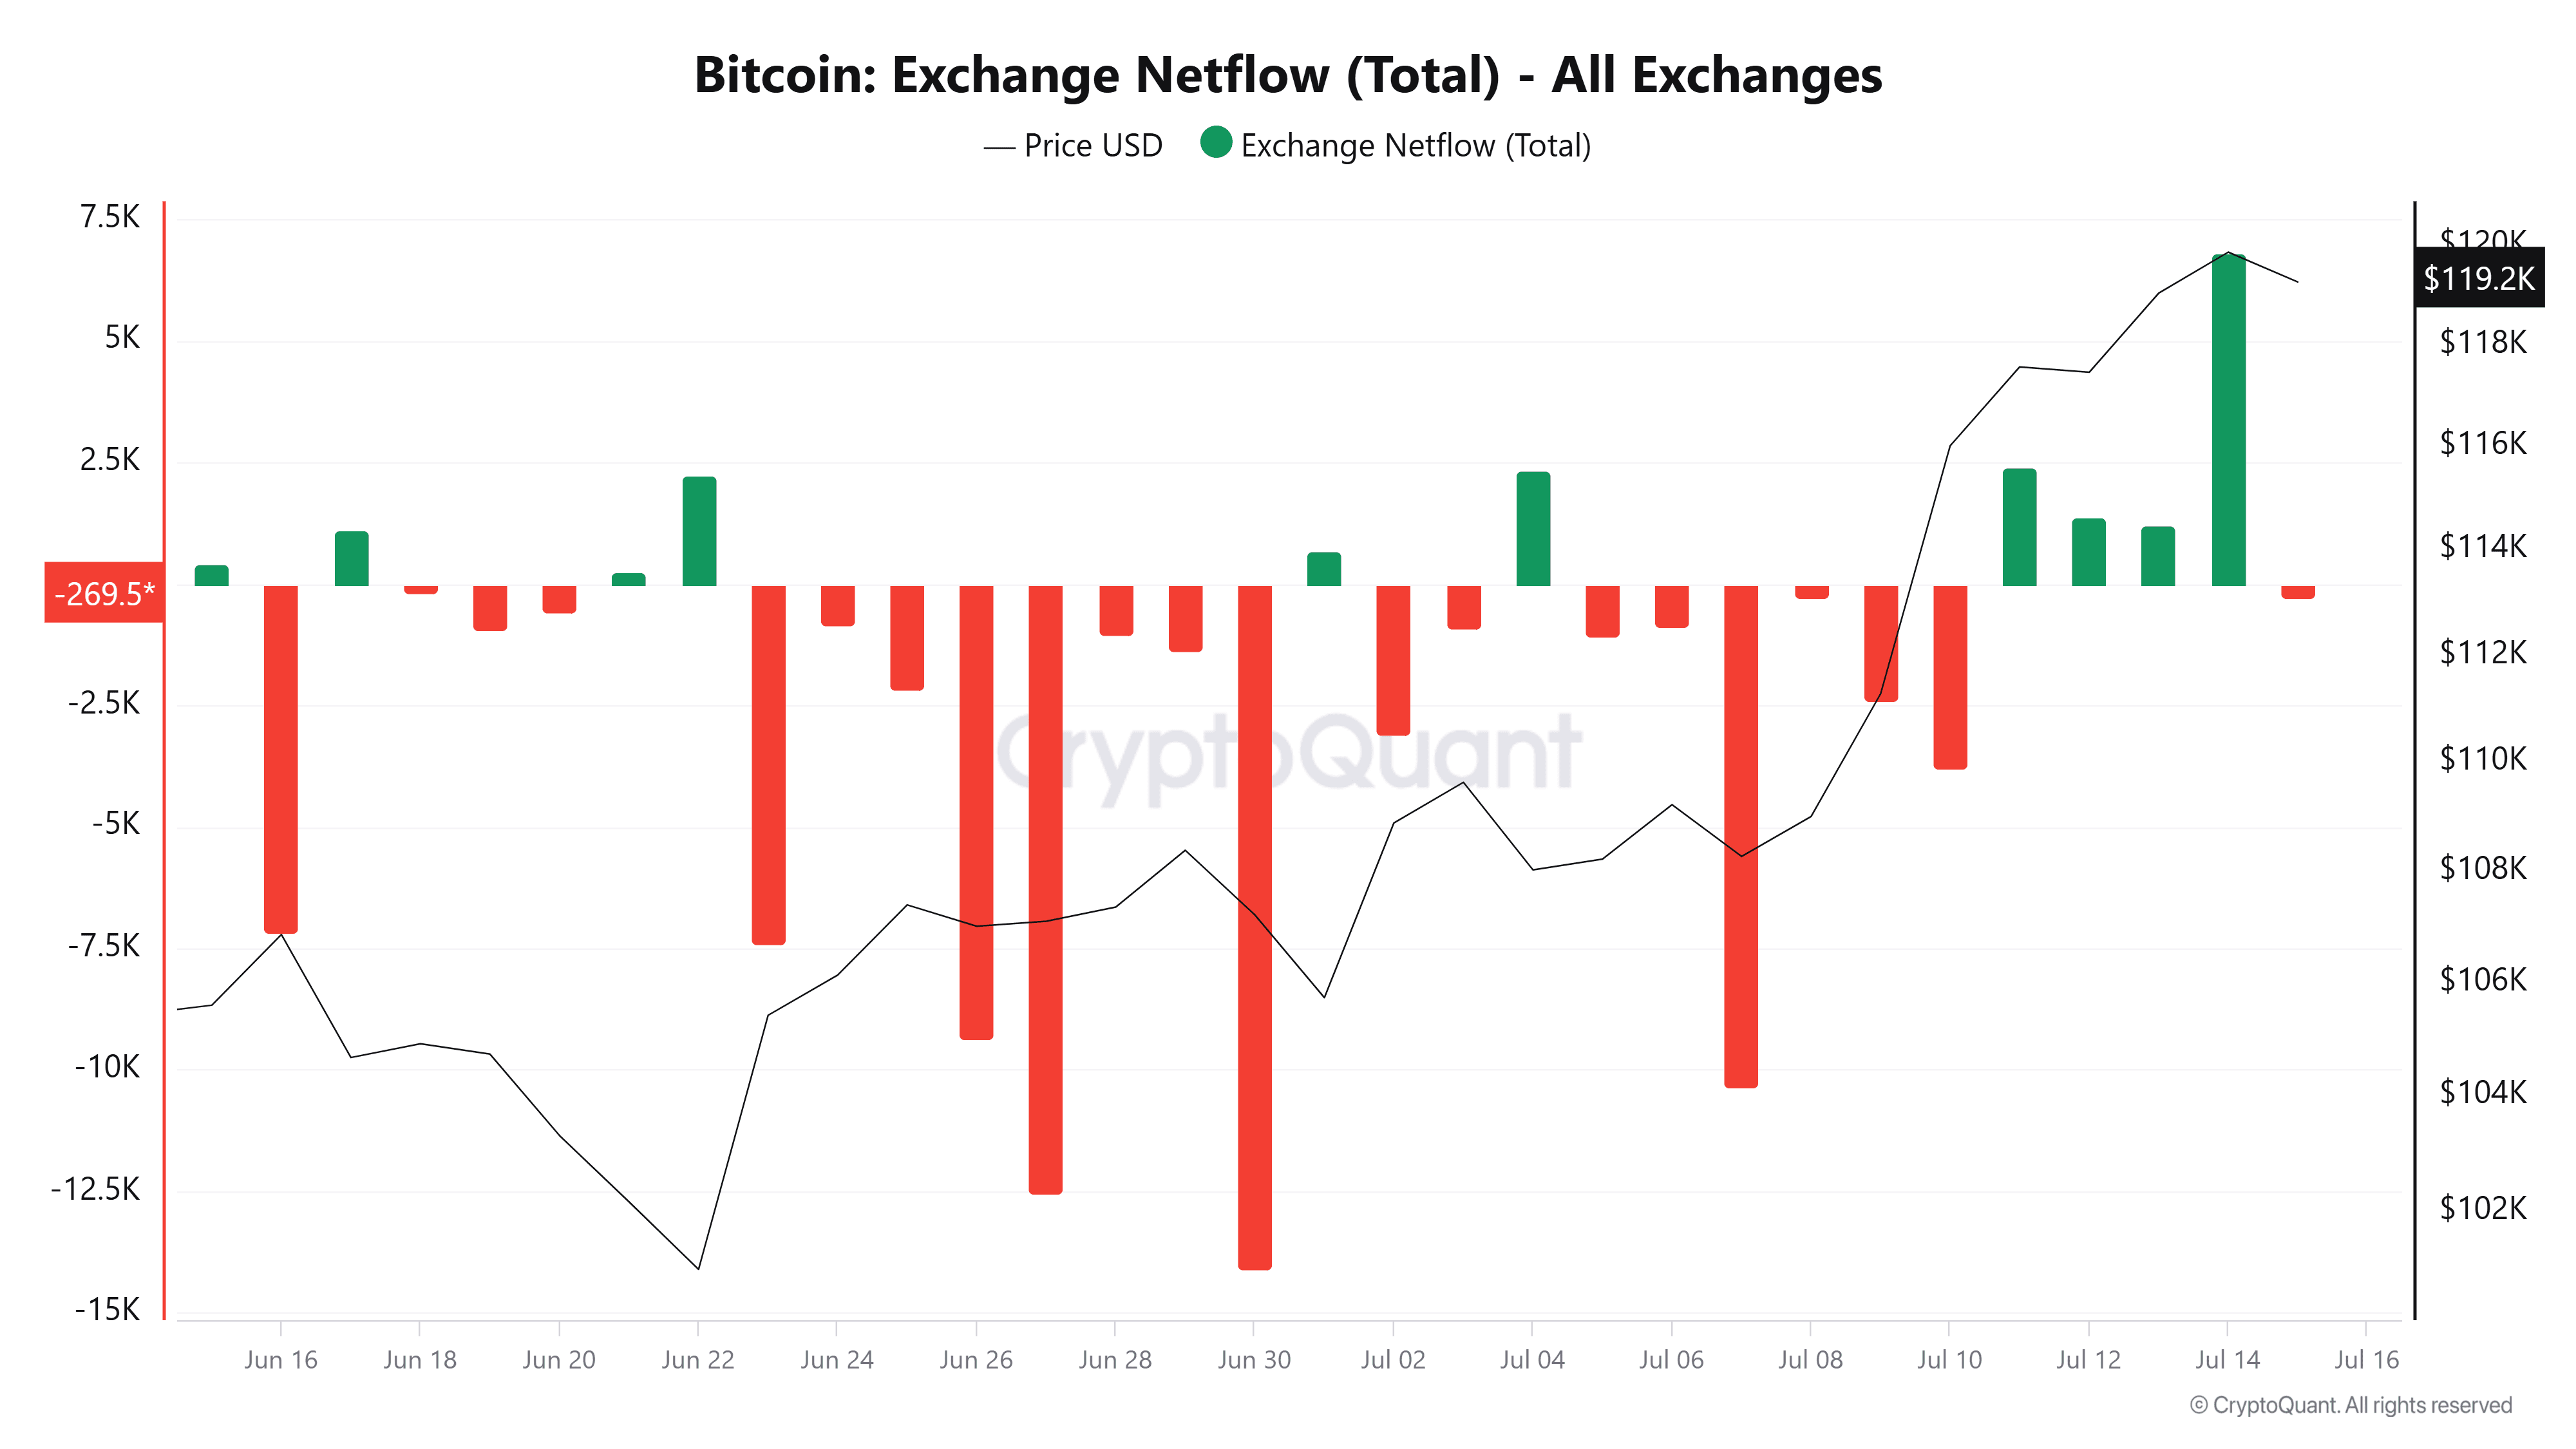
Selling activity poses a risk of retracement
Accompanying the price increase is a growing selling pressure. The Net Money Flow index of the BTC exchange (measuring the difference between the amount of Bitcoin flowing into and out of exchanges) shows that the inflows into exchanges far exceed the outflows in the past four days. This occurs when the supply of profitable BTC surges, prompting investors to take some profits.
This accelerating trend could force Bitcoin's price to correct, leading to the liquidation of some long positions.
“We maintain a structurally optimistic view on BTC, bolstered by continuous institutional investment flows and favorable macro factors. However, at the current price levels, we prioritize selectivity and do not chase the price increase but instead position ourselves in case of a price drop, should that occur,” analysts at QCP wrote in a note to investors on Monday.
