Bitcoin started the new week with excitement by surpassing $123,000, but profit-taking pressure at high price levels is beginning to appear. However, the positive signal is that buying strength remains strong enough to keep the price above the psychological level of $120,000.
According to data from Farside Investors, Bitcoin ETF funds recorded inflows of over $1 billion in two consecutive sessions – Thursday and Friday last week – marking the first time in history that two consecutive days of capital inflows exceeded a billion. This reflects strong confidence from investors that the BTC uptrend is not yet over.
Joining the buying wave, Strategy – the company led by Michael Saylor – has just 'closed a deal' for an additional 4,225 BTC after a week of pause. According to the SEC filing on Monday, this Bitcoin was purchased at an average price of about $111,827, bringing the total BTC held by the company to 601,550 BTC – an impressive number reflecting an ongoing accumulation strategy.
The proportion of BTC in the total cryptocurrency market capitalization exceeded 66% at the end of June, before a slight adjustment below 65%. This adjustment has allowed many altcoins to surge strongly in the short term.
History has shown: the altcoin season usually begins when BTC's dominance ratio (BTC.D) peaks near 70% and then turns down. Analyst Rekt Capital shared on platform X that as long as BTC.D loses a few more percentage points, the altcoin rally will explode strongly.
Will Bitcoin continue to challenge the bears, or is a short-term correction ahead? And can altcoins take advantage of this opportunity to break out? Let's analyze the charts of the top 10 cryptocurrencies to find the answers.
Technical Analysis of SPX
The S&P 500 index (SPX) is maintaining above the breakout threshold of 6.147, indicating that the bulls are still holding their position as they expect the upward trend to continue.
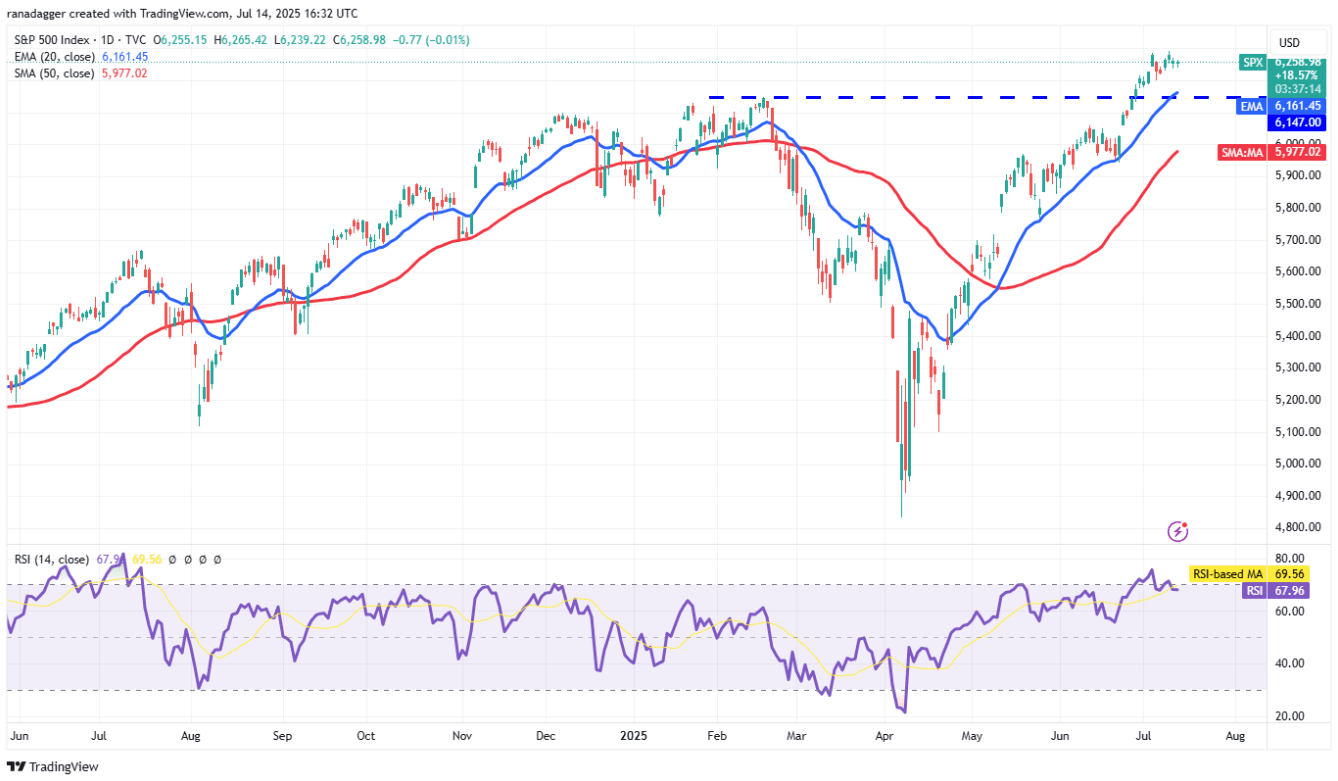
The 6.147 level is an important support level to watch. If the price breaks and closes below this level, it could trap optimistic investors, pulling the price down to the simple moving average (SMA) 50-day at 5.977.
Conversely, if the price rebounds from the current level around 6.147, it indicates that the upward trend is still intact. The index could rise to the 6.500 area – where the bears are expected to provide strong resistance.
Technical Analysis of DXY
The USD Index (DXY) has surpassed the 20-day EMA at 97.77 on Friday, indicating that selling pressure is easing.
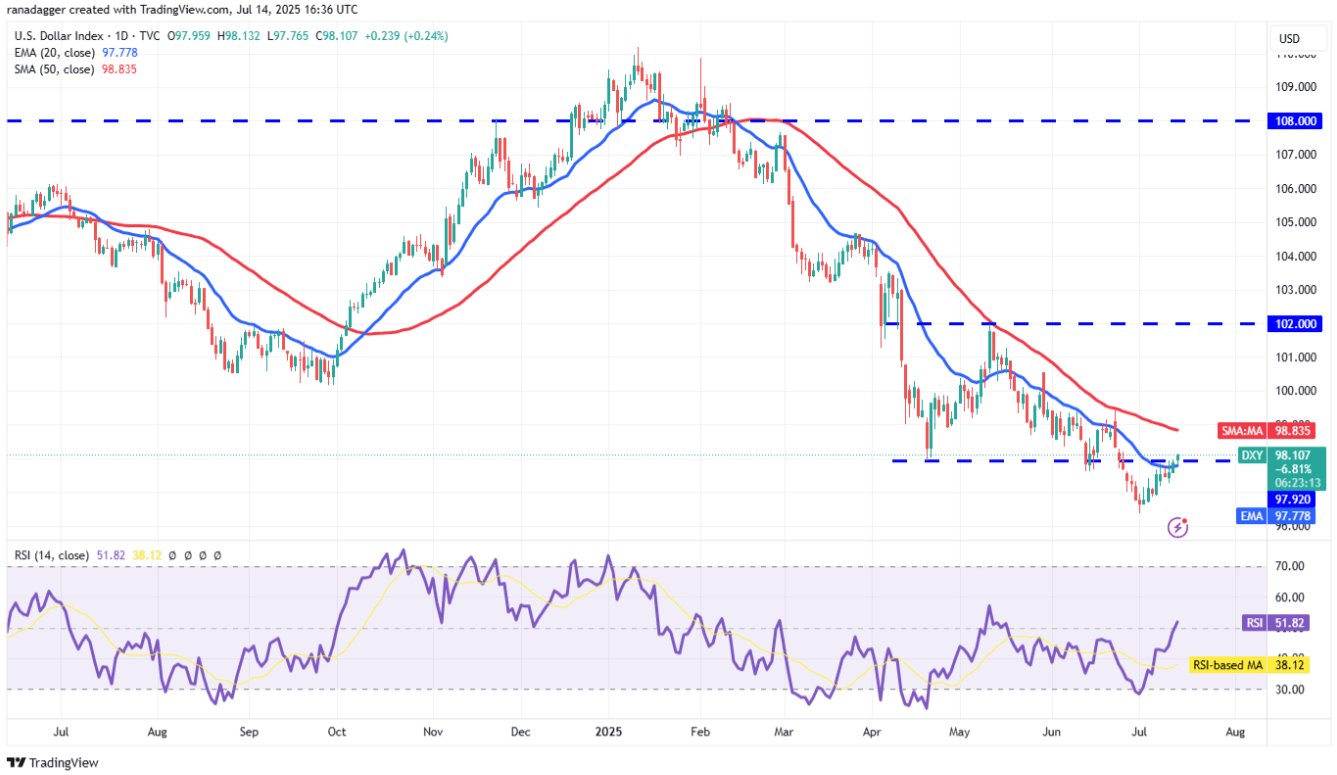
This index may continue to recover up to the 50-day SMA line at 98.83 – this is forecasted to be a strong resistance area. If the price adjusts from the 50-day SMA but rebounds from the 97.92 area, it indicates that the index is forming higher lows. At that point, the likelihood of overcoming the 50-day SMA will be reinforced. If successful, the upward momentum could push the index up to 100.54, even 102.
This positive scenario will be denied if the price sharply reverses from the current level or from the 50-day SMA and breaks through the support area of 96.37. At that point, the next downtrend could bring the index back to 95.
Technical Analysis of BTC
Bitcoin surged to a new historical peak at $123.218 on Monday, but the bulls could not maintain this high – as reflected by the long upper shadow.
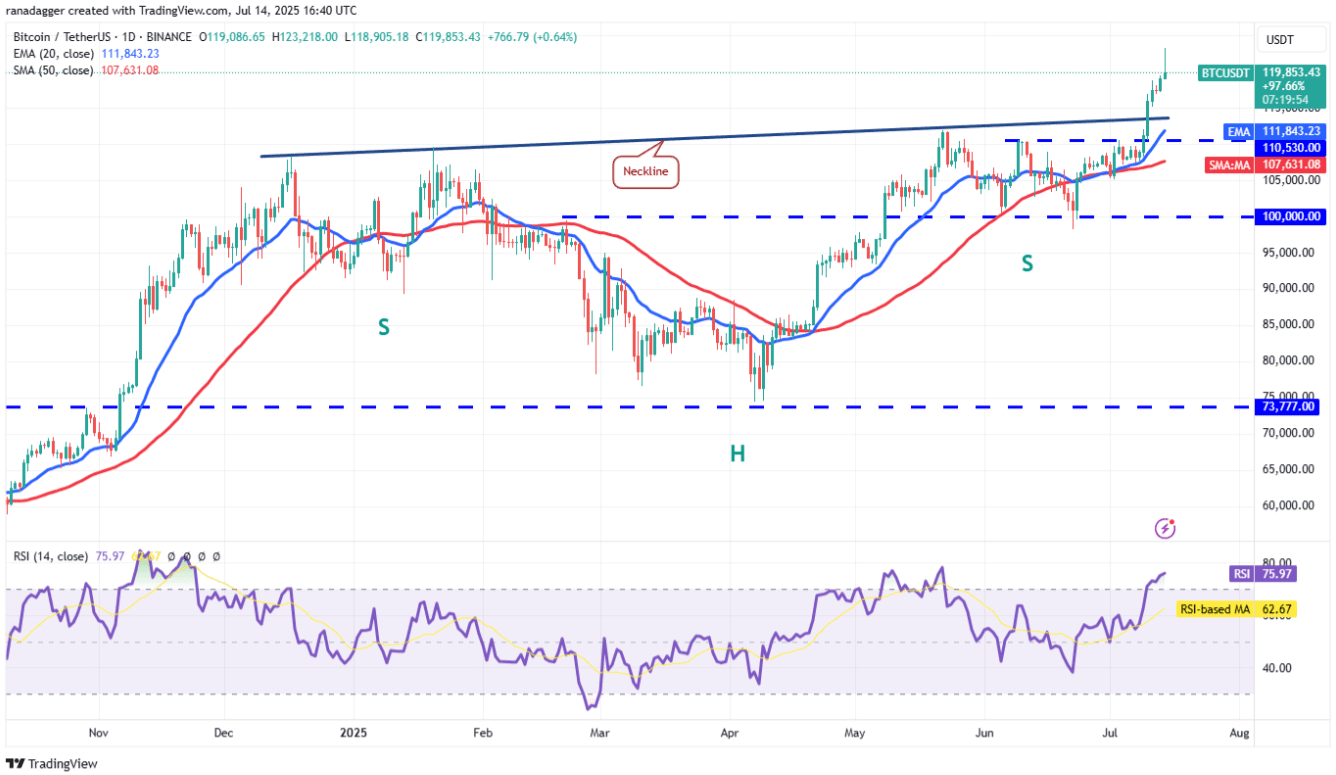
The RSI indicator is in the overbought region, indicating that the BTC/USDT pair may enter a slight correction or consolidation phase in the short term.
This adjustment is expected to find support at the 20-day EMA ($111.843). If this occurs, it will signal that the uptrend remains strong. The bulls will continue to attempt to push the price above the $123.218 mark, opening the next upward move towards the $150,000 target.
The advantage will tilt towards the bears if the price drops below the 50-day SMA ($107.631).
Technical Analysis of ETH
The long upper shadow in Monday's trading of Ether (ETH) indicates that selling pressure is significantly increasing at high price levels, suggesting that the bears have not yet given up.
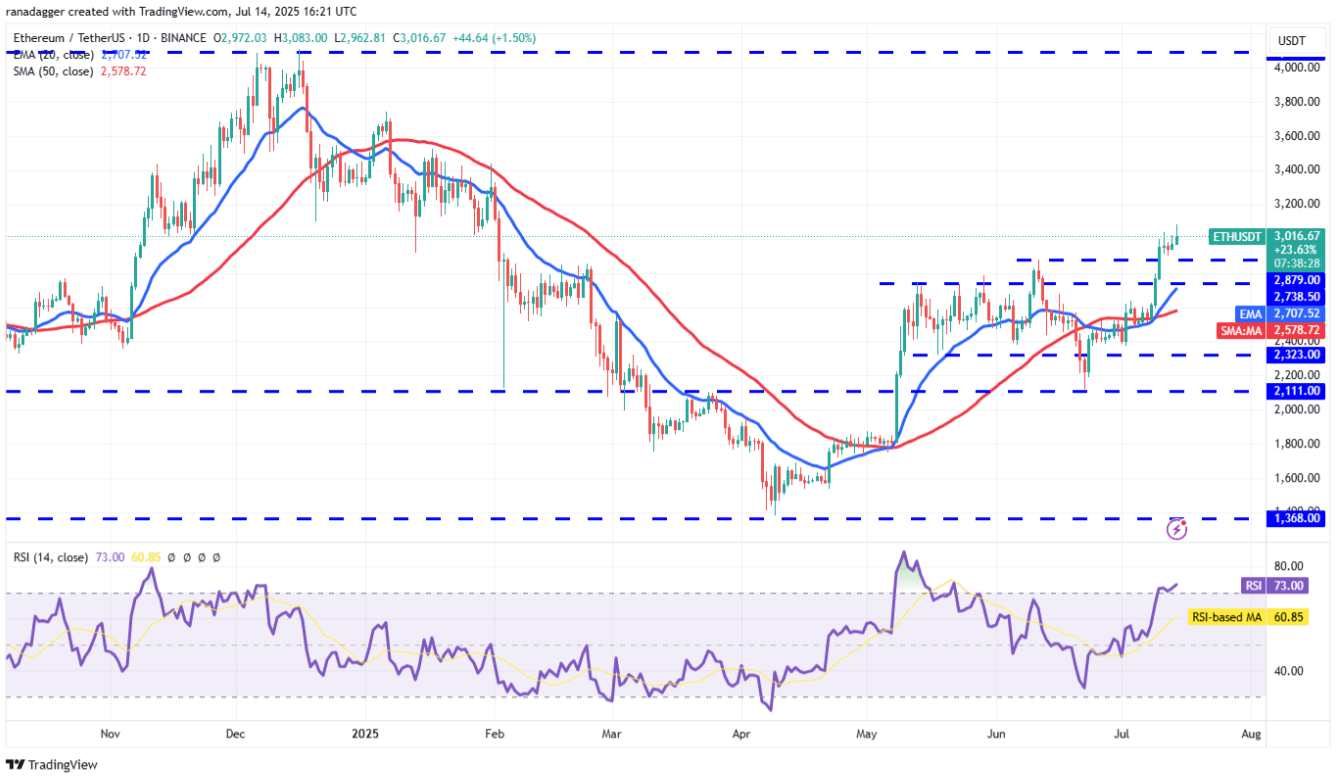
Currently, the nearest support level is at $2.879. If the price recovers from this area, it will reinforce the notion that the bulls are trying to turn this level into a solid buffer. In a positive scenario, the ETH/USDT pair could regain upward momentum and successively conquer the $3.153 and $3.400 levels.
However, if the price breaks below the $2.879 mark, that will be a signal indicating profit-taking pressure from short-term traders. At that point, ETH is likely to retreat to the 20-day EMA at $2.707. This will be a crucial frontline — if the bulls want to maintain the uptrend, they must successfully defend this support level.
Technical Analysis of XRP
XRP has broken strongly above the $2.65 resistance on Friday, indicating that buying pressure has overwhelmed selling pressure.
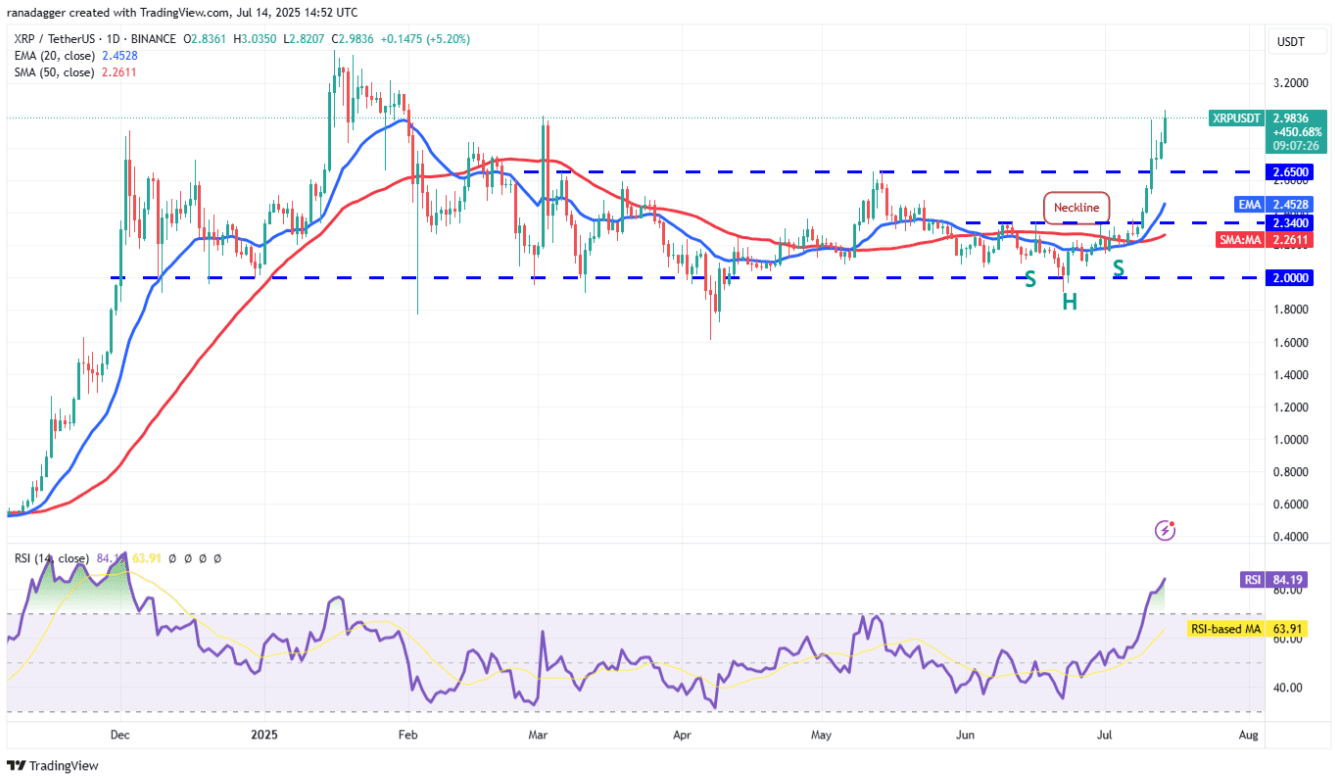
The bears attempted to push the price below $2.65 on Saturday, but the bulls maintained their position. This shows the bulls' efforts to turn $2.65 into support. The nearest resistance is $3, but if overcome, the XRP/USDT pair could rise to $3.20 and then to $3.40.
However, it should be noted that the recent uptrend has pushed the RSI into the deep overbought territory, increasing the risk of a slight correction or short-term consolidation. Nevertheless, the bulls remain in control as long as the price stays above $2.65.
Technical Analysis of BNB
BNB broke the $698 resistance on Monday, but the long upper shadow indicates that selling pressure is appearing at higher levels.
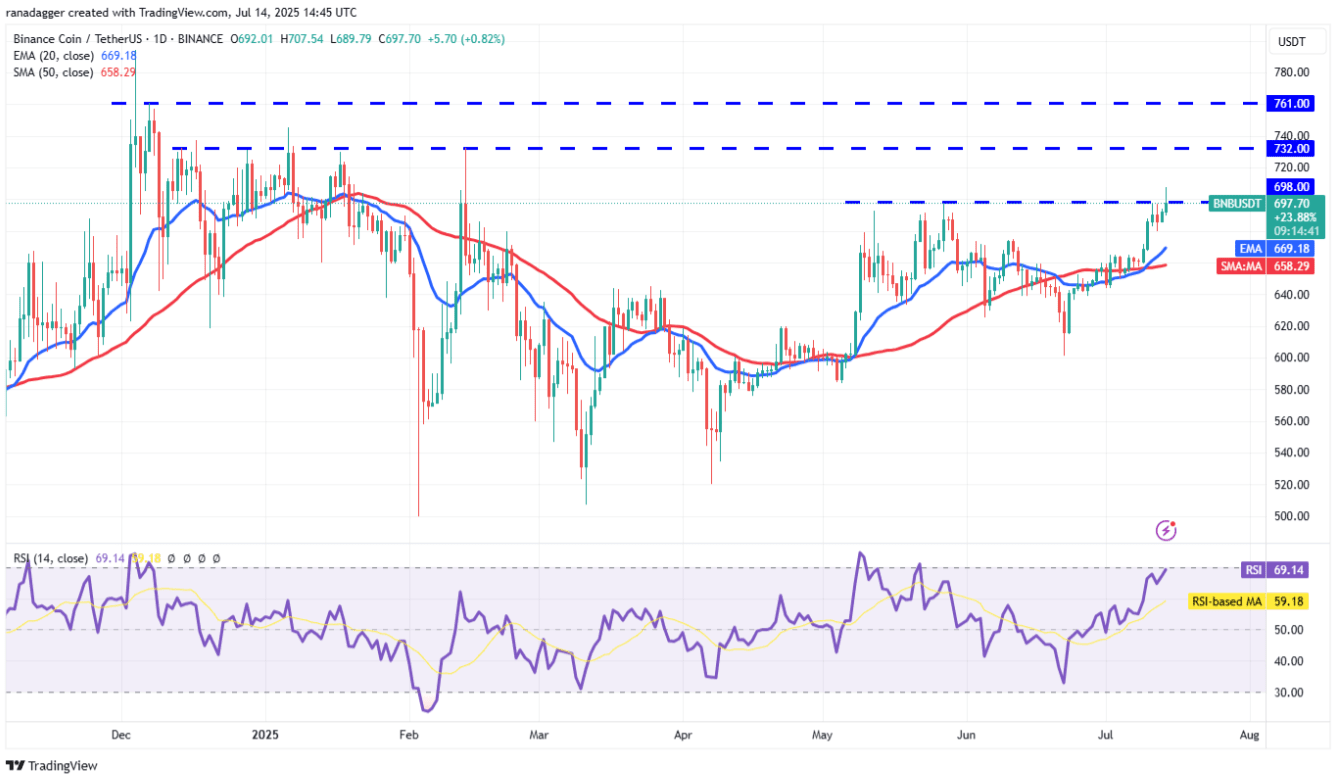
The 20-day EMA ($669) is sloping up and the RSI indicator is near the overbought region, indicating that the bulls are in control. If the price stays above $698, the BNB/USDT pair could rise to $732 and then to $761.
The 20-day EMA is an important support level to watch as the price adjusts. If this support level is broken, the pair could drop to the 50-day SMA ($658) and then to $640. This indicates that breaking above the $698 level could be a bull trap.
Technical Analysis of SOL
Solana has completed a bullish inverse head and shoulders pattern by closing above $159 on Thursday, and the bulls successfully defended the breakout price area on Saturday.
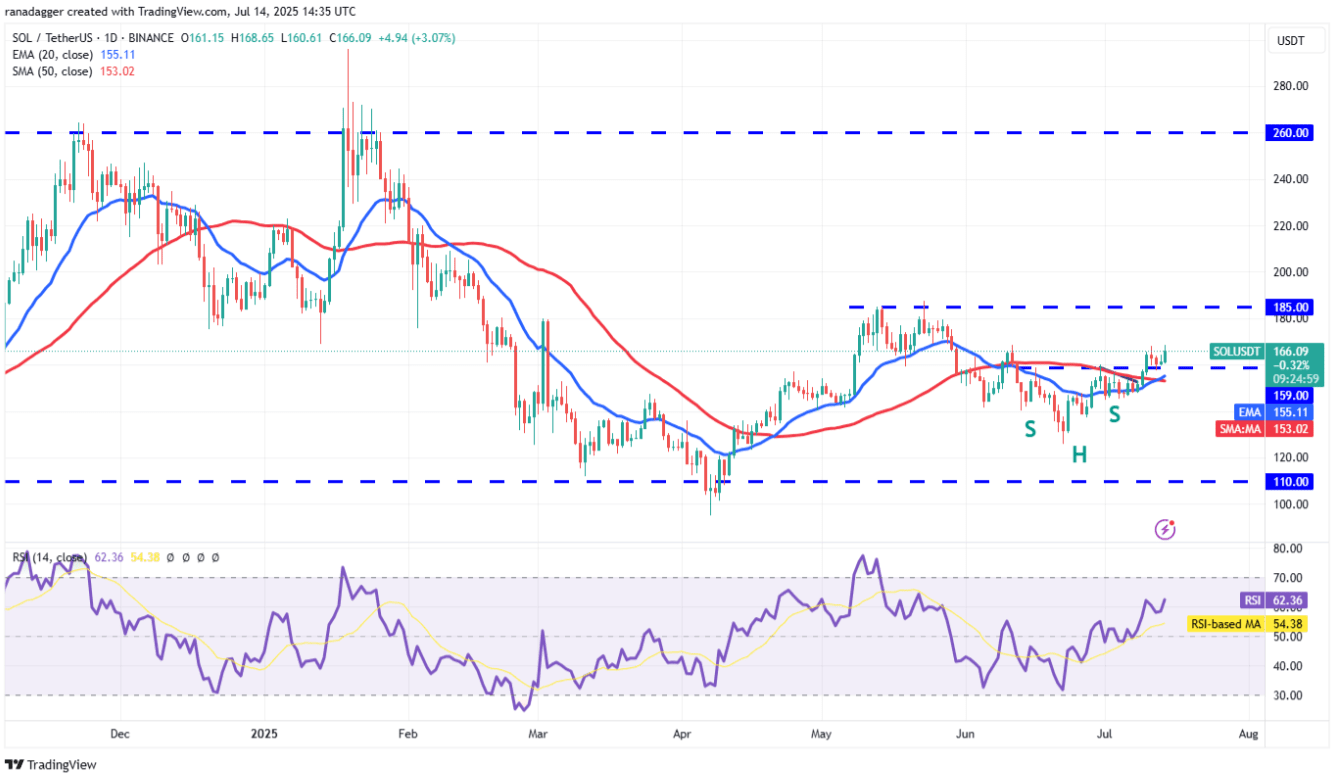
There is a small resistance at $168, but if overcome, the SOL/USDT pair could rise to $185. The bears are expected to defend strongly at the $185 area because if they fail, the pair could break out to $210 and then $220.
The 20-day EMA ($155) is an important support level to watch on the downside. The bears will need to pull the price down and maintain it below the 20-day EMA to indicate a return.
Technical Analysis of DOGE
Dogecoin is facing resistance at $0.21, but a positive signal is that the bulls have not yet lost ground to the bears.
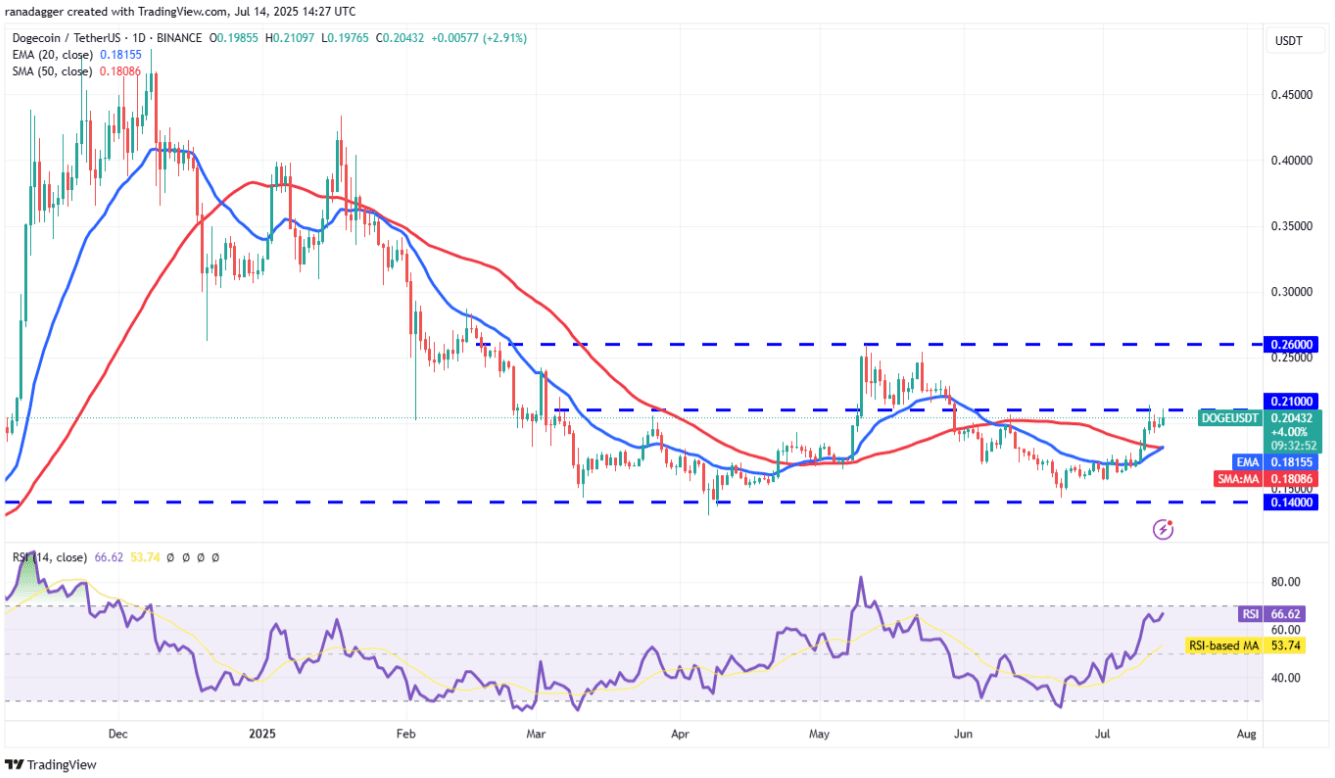
The 20-day EMA is sloping up ($0.18) and the RSI indicator is near the overbought region, indicating that the current dominant trend is upward. If the bulls push the price above $0.21, the DOGE/USDT pair may rise to $0.26. The bears are expected to defend strongly at the $0.26 area, but if the bulls win, the pair could surge to $0.35.
Nevertheless, the bears will not stay still. They will attempt to defend the upper resistance and keep the price oscillating in the $0.26 to $0.14 range for a while longer.
Technical Analysis of ADA
The bears have attempted to stop Cardano's upward momentum at the downtrend line, but the bulls have strongly broken through.
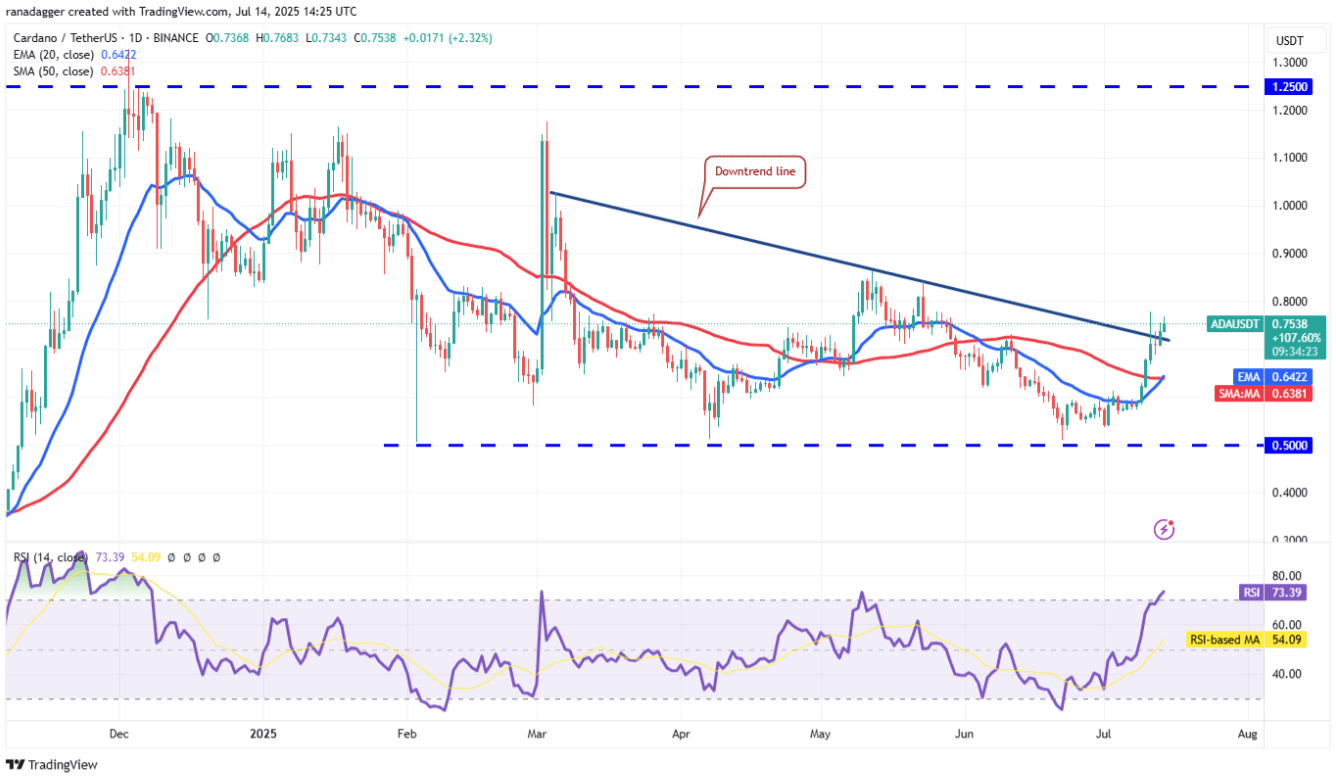
The price closing above the downtrend line on Sunday has invalidated the bearish descending triangle pattern. The ADA/USDT pair could continue to rise to $0.86, which could be a resistance area. However, the upward sloping 20-day EMA ($0.64) along with the RSI in the overbought region indicates that the advantage is tilting towards the bulls. A closing session above $0.86 could push the price up to $1.
This positive outlook will be invalidated in the short term if the price reverses and breaks below the 20-day EMA. This would indicate that the breakout above the downtrend line could be just a bull trap.
Technical Analysis of HYPE
Hyperliquid (HYPE) has broken above the $45.80 resistance area on Friday, signaling the continuation of the upward trend.
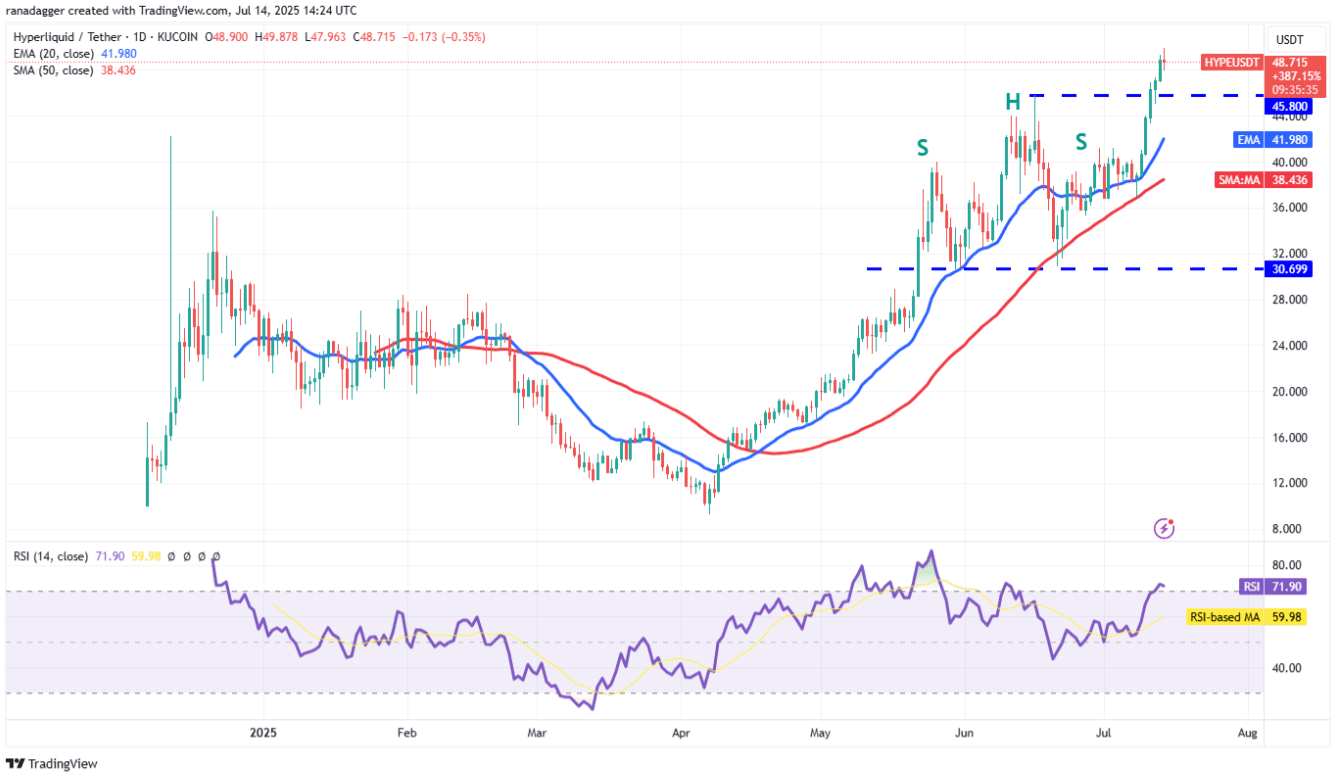
The HYPE/USDT pair has now reached $50 – an important psychological milestone, where the bears are expected to set up strong defenses. If the price adjusts from $50 but rebounds from $45.80, it indicates that bullish momentum is still being maintained. At that point, it is highly likely that the price will continue to rise to the $60 area.
The first signal of weakness will appear if the price breaks and closes below $45.80. At that point, the pair could retreat to the 20-day EMA ($41.98), which is seen as an area attracting buying pressure.