BTC just did it.
We’ve officially broken out of the bull flag formation… and if history repeats?
👀 The next stop is $130,000 — and possibly much higher.
Small personal comment and non-binding estimate. If Bitcoin does not hold at $110,000, it will fall back to $96,000.
📊 What’s Happening?
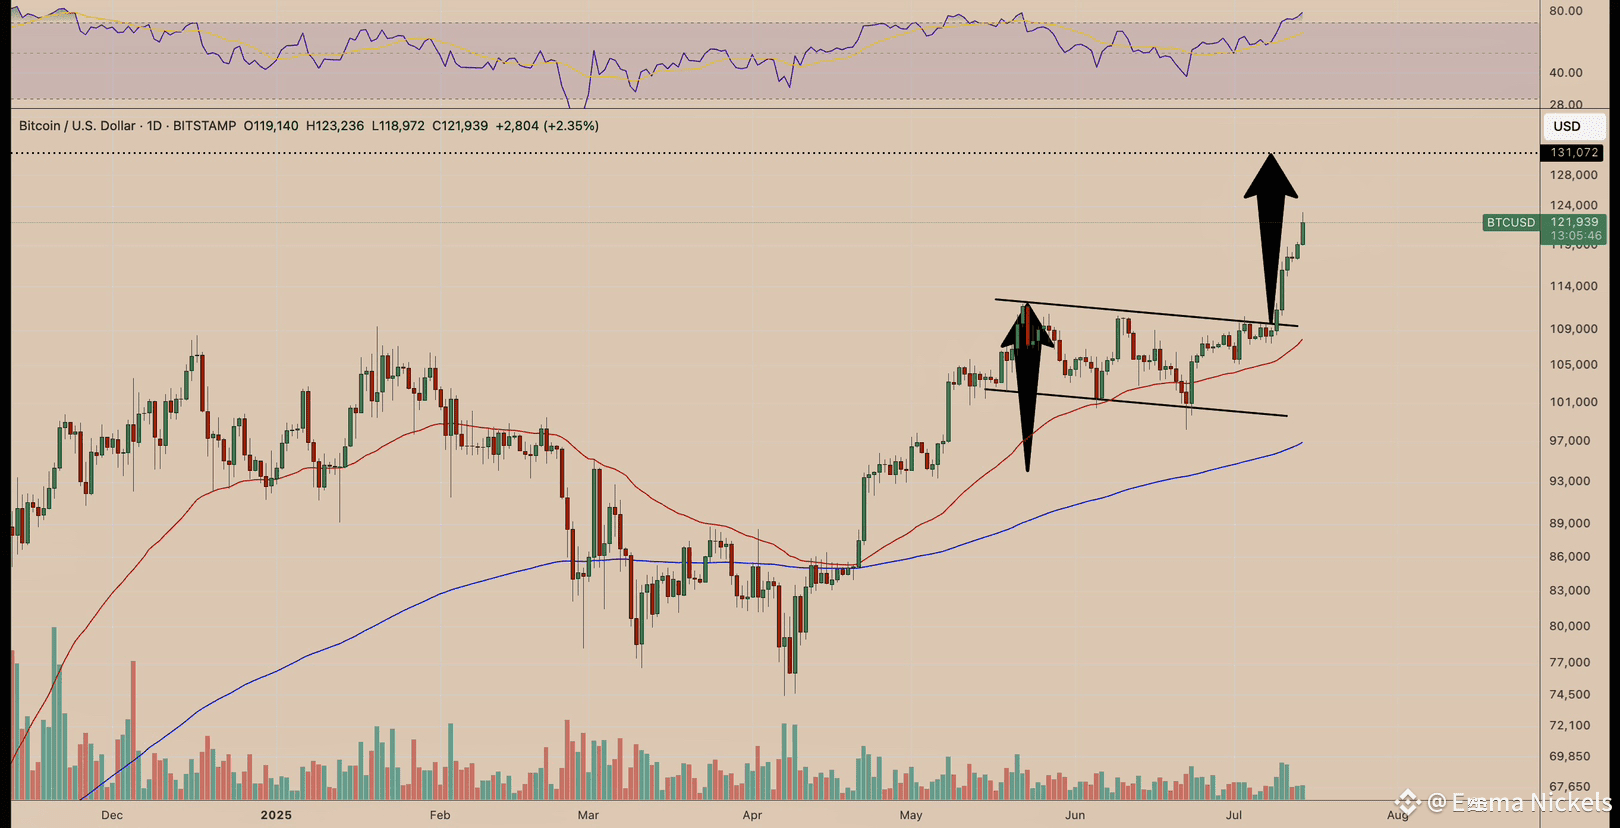
On July 9, Bitcoin smashed above the upper trendline of a textbook bull flag.
✅ Volume confirmed the breakout
✅ Target? $130K — based on the flagpole projection
✅ And it’s not just the charts saying so…
🔎 On-Chain Says the Same Thing
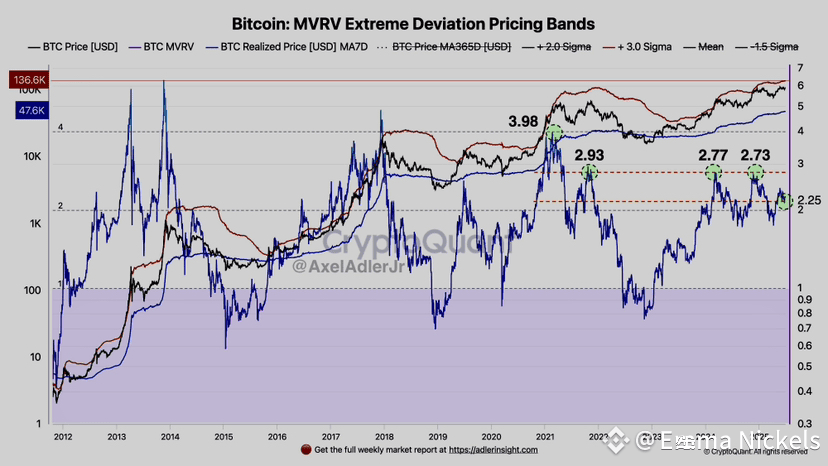
🧠 Analyst Axel Adler Jr. points to the MVRV ratio, a key on-chain signal.
Whenever it hits 2.75, long-term holders start taking profits.
Guess where that level is now?
👉 $130,900
📌 That’s confluence — when technicals + on-chain align = 🚀
🏆 Bigger Targets? Cup & Handle Says Yes
Analyst RJT.WAGMI spotted a daily cup-and-handle breakout, with a target at:
🎯 $150,000 — a clean 33% upside from $110K zone
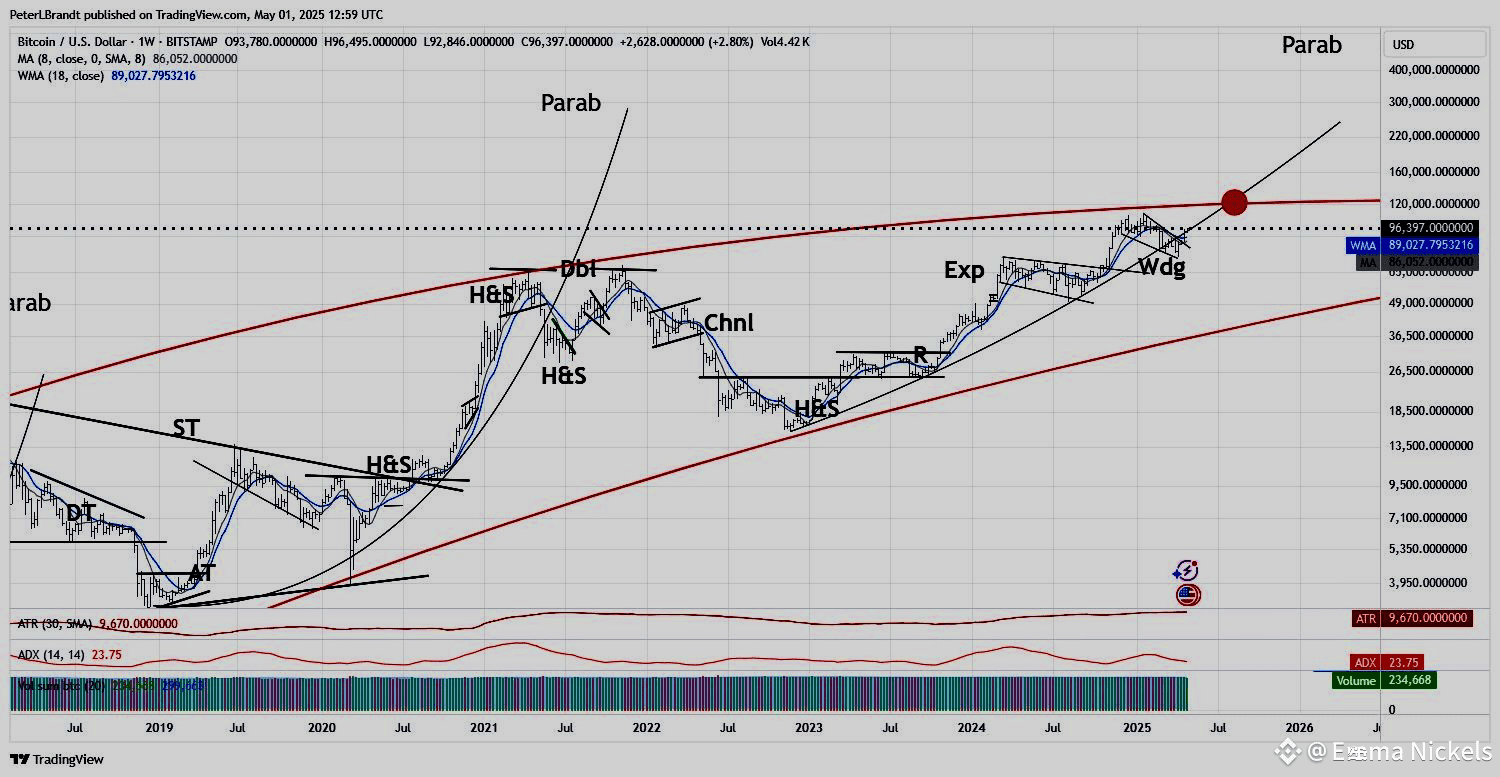
Even Peter Brandt and Kyle Reidhead are calling for $125K–$150K by Q3
This is becoming a consensus rally. 📢
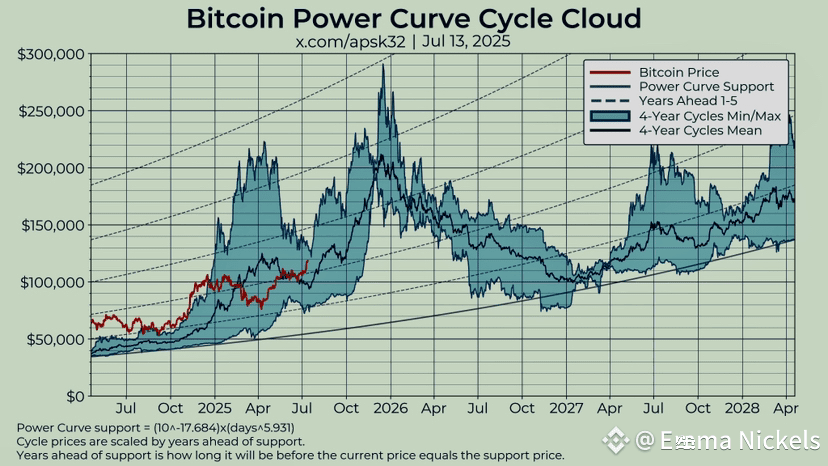
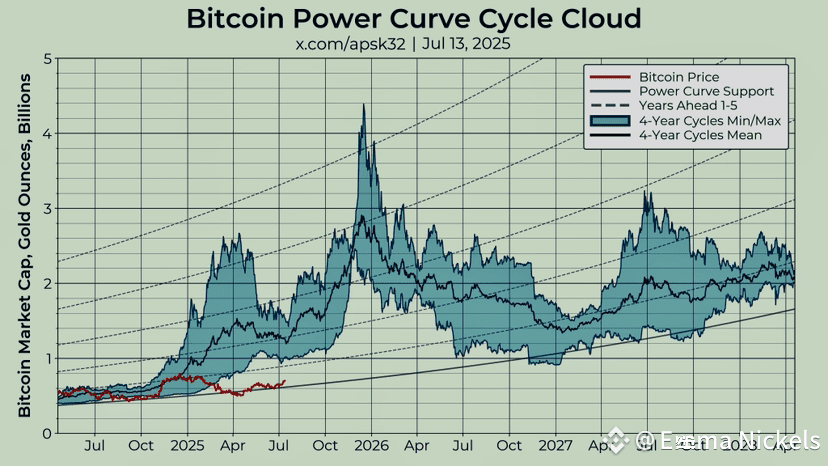
🌩️ Power Curve Model: $200K Peak Ahead?
According to apsk32, BTC is still tracking the Power Curve Cycle Cloud
☁️ Historic data points to a peak near $200K by Nov/Dec 2025
It’s the 18–20 month post-halving window—right on time.
When priced in gold, the cycle hasn’t even heated up yet.
That means we might be in Act I of the bull run. 🎬
🧠 What Smart Traders Are Doing:
✅ Watching $130K as the next key breakout zone
✅ Eyeing $150K as the full cup-and-handle extension
✅ Staying open to $200K+ based on cycle modeling
✅ Front-running ETF inflows & global risk sentiment 🪙📉
📌 Bottom Line:
This isn’t hopium.
It’s structure-backed, on-chain-verified, historically-aligned upside.
🚨 If you’re not positioning now, you might be chasing later.
⸻
📣 Bulls, is this the beginning of the parabolic phase?
👇 Drop your targets in the comments. Let’s chart the climb together. 🌕
#AxelAdler #PeterBrandt #BitcoinTraders #CryptoSignals #SatoshiSeason #PowerCurve #NextAllTimeHigh