Chart Overview:
The $BTC
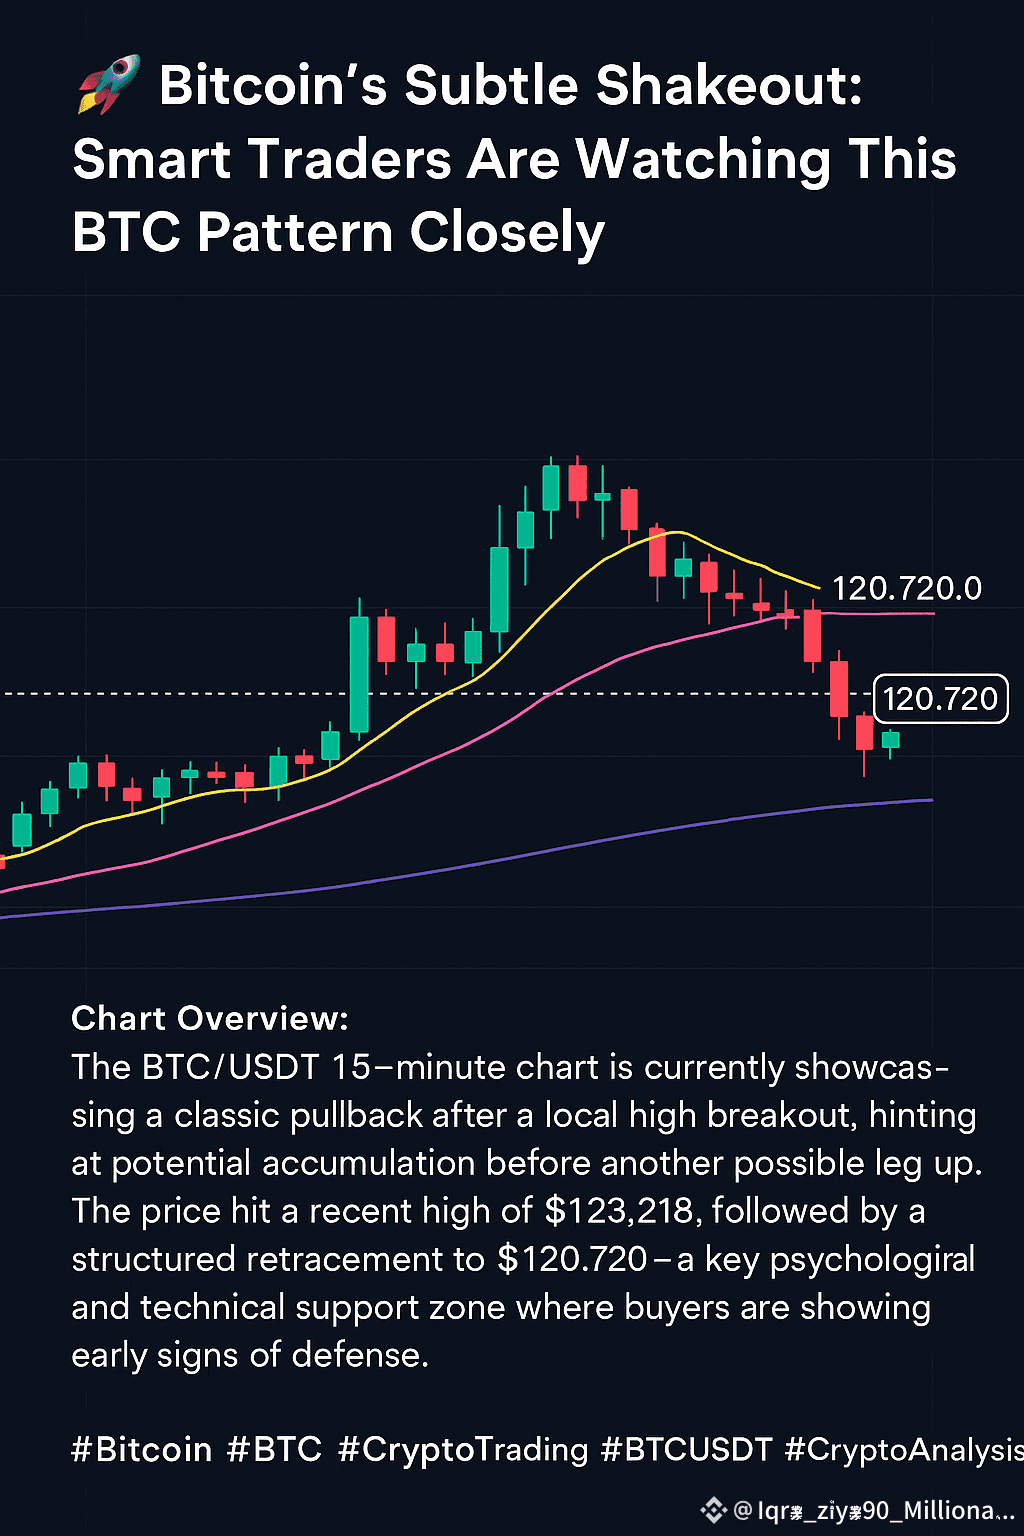
BTC/USDT 15-minute chart is currently showcasing a classic pullback after a local high breakout, hinting at potential accumulation before another possible leg up. The price hit a recent high of $BTC $123,218, followed by a structured retracement to $BTC $120,720—a key psychological and technical support zone where buyers are showing early signs of defense.
📉 But what makes this chart interesting?
This isn’t just any retracement. This is a textbook stair-step bullish structure. The price action shows strong bullish candles, a brief sideways consolidation, and now a controlled dip. This often indicates whales shaking out weak hands before driving prices higher.
🔑 Key Technical Highlights:
Support Holding: Price tested the 99 EMA and held above it with volume tapering off—potential sign of exhaustion from sellers.
MA Confluence: The 7, 25, and 99 MAs are compressing—setting up a potential squeeze play.
Volume Shift: Volume dropped on the red candles, indicating less conviction on the downside.
📊 What Should Traders Watch Next?
If BTC holds above the $120,000–$120,700 zone and pushes back above the 25 EMA (~$121,649), it could initiate a fresh breakout—possibly retesting $123K and beyond. However, a breakdown below $120K may indicate more downside or a longer consolidation phase.
🔮 Market Sentiment: Neutral-Bullish
This pattern suggests institutions might be accumulating quietly while retail panics during the dip. Seasoned traders know—moves like this often come before a breakout.
💡 Final Thoughts:
If you're trading Bitcoin on lower timeframes, this current chart could be a golden setup. Whether you’re a scalper, swing trader, or long-term HODLer—this is a pattern worth keeping on your radar.
#BTC走势分析 #Binance #crypto #cryptosignals #BinanceSquareTalks