Meme coins like Dogecoin (DOGE), Shiba Inu (SHIB), and Pepe (PEPE) all recorded increases of more than 4% at the time of writing on Monday, following the strong breakout of Bitcoin (BTC) as it surpassed the $122,000 mark. The improvement in investor risk appetite has driven capital into speculative assets like meme coins, pushing the total market capitalization of this segment above $69 billion.
In light of the positive developments of DOGE, SHIB, and PEPE, market sentiment has become lively with expectations that the rally will continue to spread. Current technical indicators lean towards a bullish trend, showing that buying pressure is prevailing if the meme coin group maintains its current momentum.
Dogecoin recovers, reclaiming the $0.20 mark.
Dogecoin surged more than 4% at the time of writing on Monday, breaking above the 200-day EMA line at $0.2028, after completing a rounded bottom reversal pattern – a technical signal for a bullish trend.
If DOGE can maintain a decisive closing above this level, the bullish trend could be reinforced and extend to the resistance area of $0.2145 – a price level that was tested last Friday. If it surpasses this level, the coin could aim for the important psychological mark of $0.2500, and further towards the peak on May 11 at $0.2597.
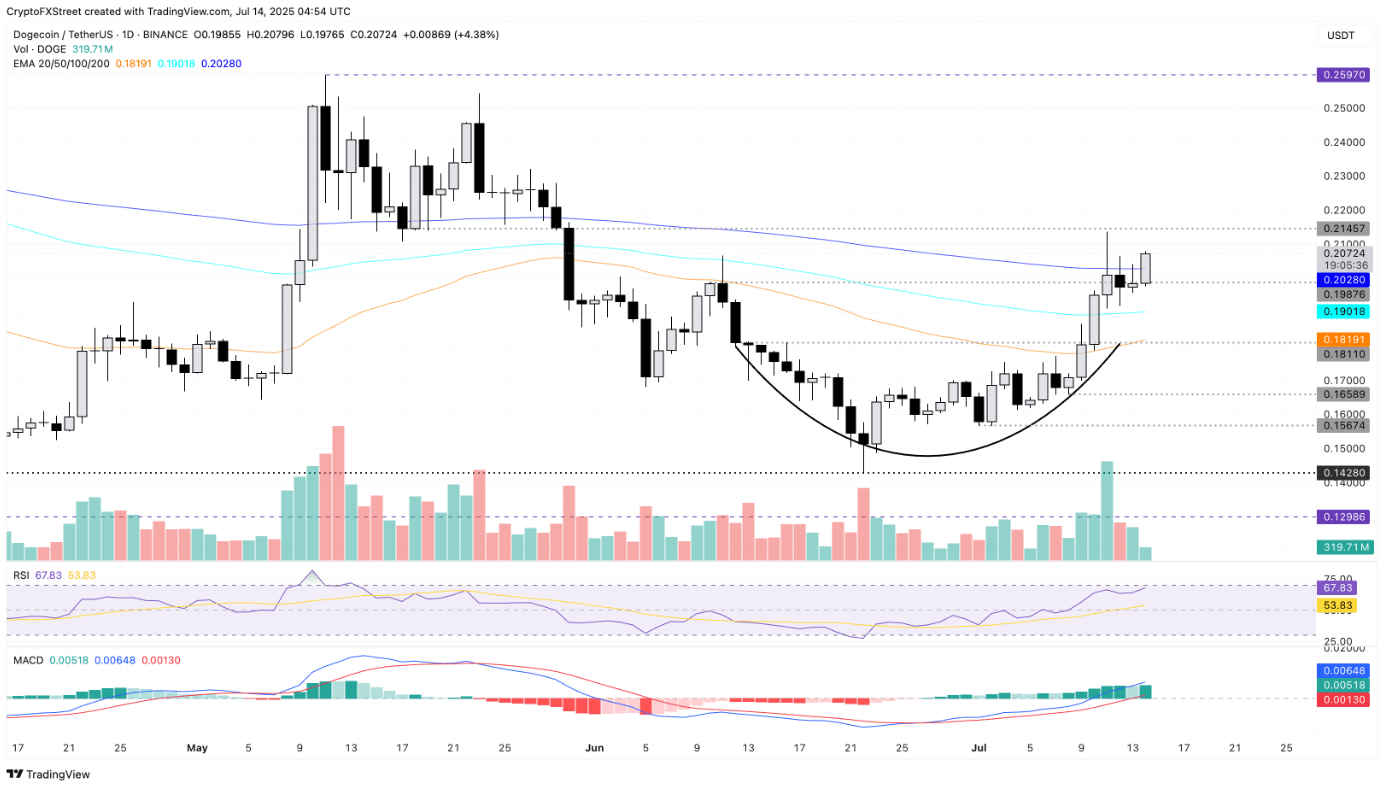
Current technical indicators also support the bullish trend: the relative strength index (RSI) on the daily frame has reached 67 – close to the overbought region, while the MACD indicator shows the histogram bars are expanding above the 0 line, reflecting a clearly strengthening upward momentum.
However, if DOGE cannot hold above the 200-day EMA at $0.2028, corrective pressure could pull the price down to the next support area around the 100-day EMA, corresponding to the level of $0.1901.
Shiba Inu is heading towards a new increase amid a strong bullish wave.
Shiba Inu (SHIB) surged more than 4% on Monday, after recovering from the 100-day exponential moving average (EMA) — a positive technical signal for the start of the new week. This upward momentum was clearly driven by a series of Doji candles that appeared since Friday, indicating that buying pressure is returning as SHIB tests this important support area again.
Currently, SHIB is heading towards the nearest resistance level at $0.00001421 – a level that previously served as strong support at the end of May. If the price can close above this level, the next target will be $0.00001567 – the nearest peak established on May 23. However, the 200-day EMA at $0.00001452 remains a short-term technical barrier that SHIB needs to overcome.
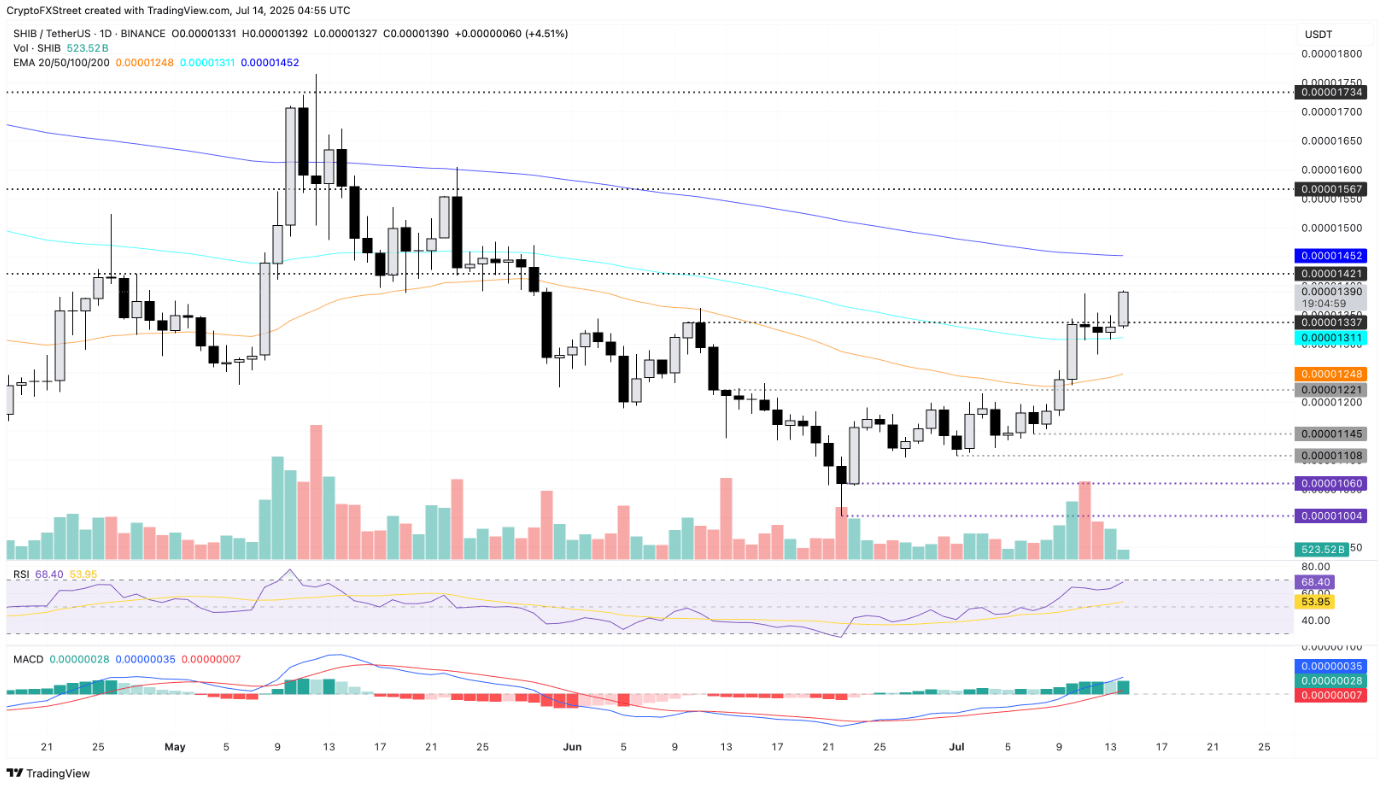
The RSI indicator is approaching the overbought area with a level of 68 on the daily frame, while the MACD continues to send positive signals with the histogram maintaining above the 0 line and gradually increasing, reflecting that the recovery momentum is being reinforced.
In a negative scenario, if SHIB weakens and closes below the 100-day EMA, this coin could turn back to test the 50-day EMA at the level of $0.00001248.
The golden cross signal of PEPE suggests a prolonged bullish rally.
Pepe (PEPE) is making a strong impression as it leads the rally of the meme coin group with a 6% increase at the time of writing on Monday, after a quiet trading weekend with Doji candles forming around the level of $0.00001200. The breakout above the descending triangle pattern on the daily chart has triggered a series of positive technical signals, drawing attention from investors.
If PEPE surpasses the important resistance level at $0.00001362 – a peak that was rejected on June 10 – the upward trend could continue to expand, aiming for the peak on May 23 at $0.00001632.
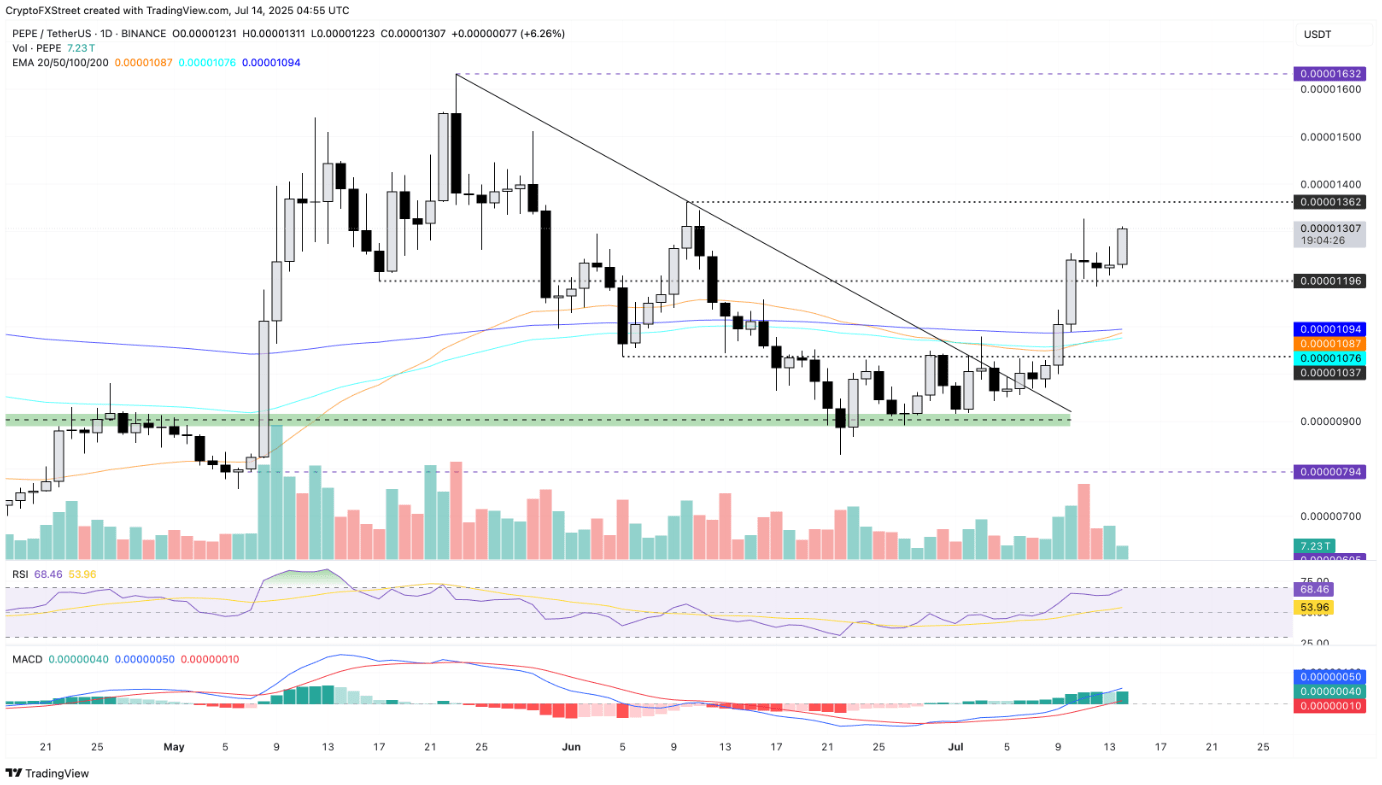
Investors waiting for opportunities may want to keep an eye on the 'golden cross' signal, as the 50-day exponential moving average (EMA) has just crossed above the 200-day EMA – a sign that short-term upward momentum is gradually overshadowing the long-term stagnation trend. At the same time, other technical indicators are also supporting the bullish trend: the RSI has reached 68, approaching the overbought area, while both the MACD line and the signal line have crossed above the 0 mark – further reinforcing the bullish outlook.
However, the reversal scenario still needs to be considered. If PEPE cannot hold the support level of $0.00001196 – which was tested on Saturday – selling pressure could push the price back to the 200-day EMA line, around the level of $0.00001094.