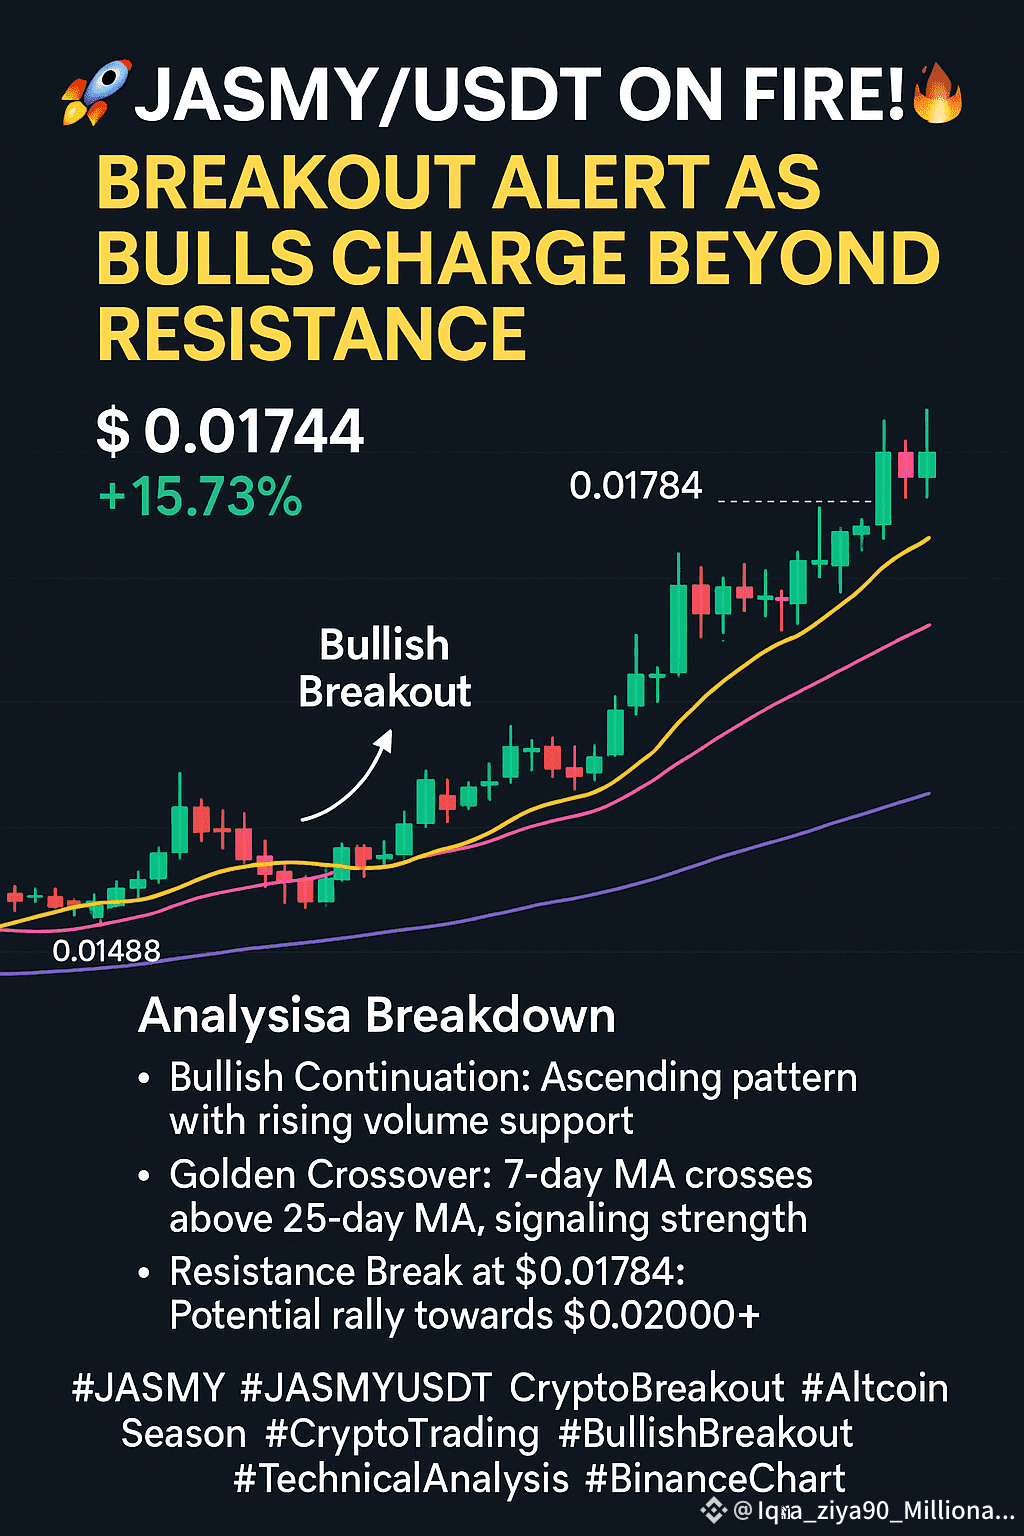
JASMY/USDT has ignited a powerful upward movement, surging to $0.01744 with a massive +15.73% gain. This isn't just a random spike — it’s a technically significant bullish breakout pattern that could potentially pave the way for a much larger rally.
Let’s dive into why this chart is turning heads on Binance, TradingView, and across the crypto space:
📊 Chart Analysis Breakdown
Rising Volume Momentum: As the breakout occurred, we saw a massive increase in volume (over 5.78M JASMY traded), suggesting high trader confidence and FOMO building.
Resistance Break at $0.01784: Price pierced the recent ceiling and is now attempting to retest this level as support — a critical phase that could open the door to a rally toward $0.02000 and beyond.
🔍 What Makes This Pattern So Interesting?
This isn’t just another pump — it’s a structured, technically supported ascending triangle breakout. The higher lows and clear breakout point at $0.0178 align with historical bullish patterns. The chart is showing buyer strength and strong sentiment, particularly in short-term scalping and day-trading strategies.
📈 Short-Term Targets
Breakout Goal: $0.0200 – psychological resistance.
Stop Loss Zone: $0.0165 – below 25MA support, managing risk is crucial.
💬 Final Thoughts
If you’re a crypto trader looking for explosive setups with real momentum, $JASMY JASMY/USDT is one to keep on your radar. The volume spike and moving average crossovers indicate strong institutional and retail participation.
But as always — don’t chase candles blindly. Watch for confirmation, monitor volume, and use trailing stops.
🚨 Disclaimer:
This content is for educational and informational purposes only. Not financial advice. Do your own research (DYOR) and invest responsibly.
#Jasmyusdt⚠️⚠️ #altcoins #Binance #crypto #blockchain