If you were to define the cryptocurrency space, how would you describe it? Everyone may have different answers, but no one can prove whether their definition is right or wrong. Any statement has its reasonable conditions, and any statement also has its inapplicable circumstances; this is the essence of "chaos."
In the chaotic market, many people always try to see everything clearly, but the longer one survives in the market, the more they can feel that the market itself is disordered. "Simplicity is the ultimate sophistication" may be the most effective principle in facing the market.
I have been in the cryptocurrency space for a full decade, experiencing three bull-bear cycles, starting with a principal of 50,000 to achieving financial freedom today.
In the seven years of professional cryptocurrency trading, I have experienced ups and downs, transitioning from debt to financial freedom, a leap in social class. During this time, I have earned and lost, engaged in various activities like trading, ICOs, mining, and more. I have encountered countless pitfalls, which are described as a game of longs and shorts, but it feels more like managing one’s mindset. There are surprises and disappointments in this magical circle, a place full of charm. I have summarized numerous strategies and methods, but ultimately, the only way to make money is simple and brutal: buy in a bear market, sell in a bull market, and you will profit without fail.
In the cryptocurrency space, many newcomers may not know how to read the MACD indicator, and understanding comes little by little. Few can discern details and technical patterns. As the saying goes, mastering one technique can take you far; it is not difficult to grasp a technology you can understand, but it is challenging if you do not want to learn or are unwilling to learn. Trading cryptocurrencies is for yourself, not for others. If you are willing to put in the effort and master it, trading cryptocurrency won't be as difficult as you imagine.
This article will discuss the MACD trading method! My operational model is not difficult to replicate; save it for later. If you find it useless after reading, feel free to criticize it.
First, let’s look at what the MACD indicator is.
The MACD indicator consists of two lines and one histogram. The fast line is DIF (white line), the slow line is DEA (yellow line), and the histogram represents MACD.
Basic Practical Use of MACD
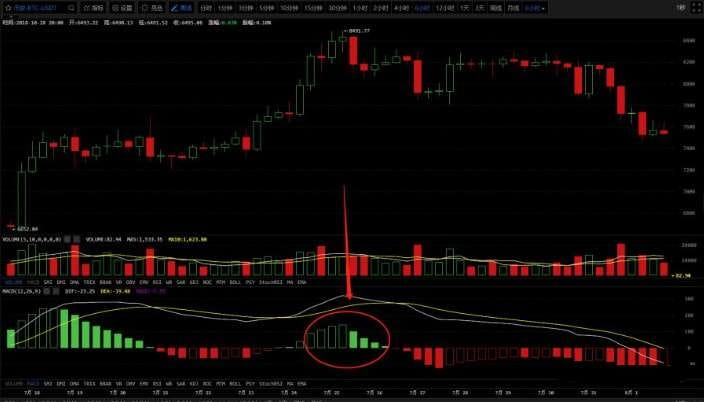
MACD Golden Cross: DIFF crosses up through DEA, signaling a buy.
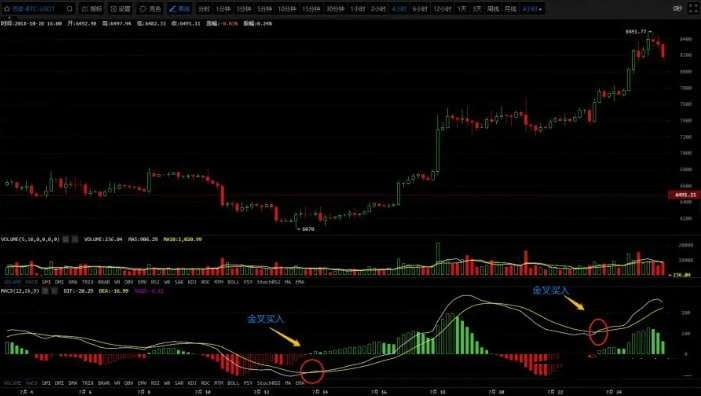
You can see that when the white line of the MACD crosses above the yellow line, it forms a golden cross in the chart, and the price begins to rise. When the MACD continues to rise, the price also oscillates upward. Therefore, the golden cross of the MACD can be seen as a simple buy signal, applicable across 1-hour, 4-hour, and daily time frames.
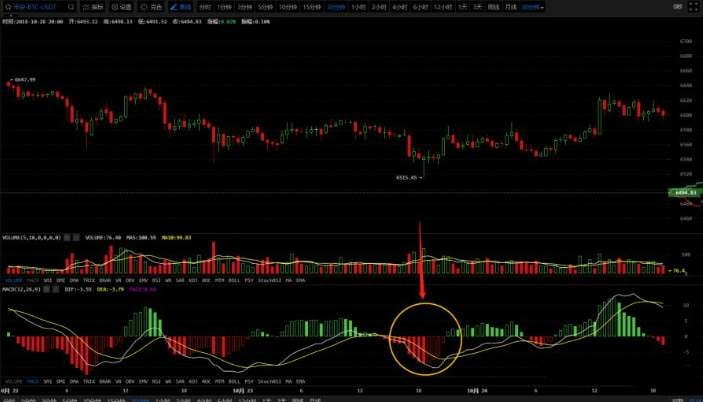
MACD Death Cross: DIFF crosses down through DEA, signaling a sell.
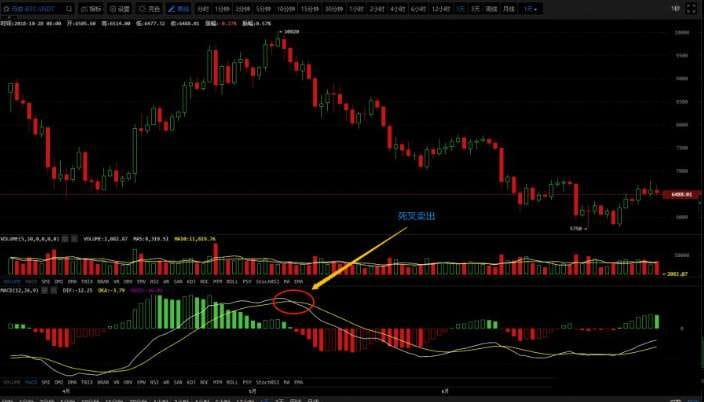
In the above BTC candlestick chart, you can see that when the white line of the MACD crosses below the yellow line, this is referred to as a death cross. After the death cross, it indicates that a downward trend may commence, so a death cross is a bearish signal.
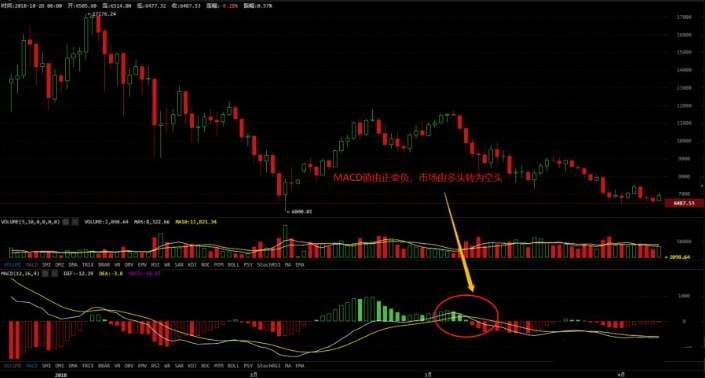
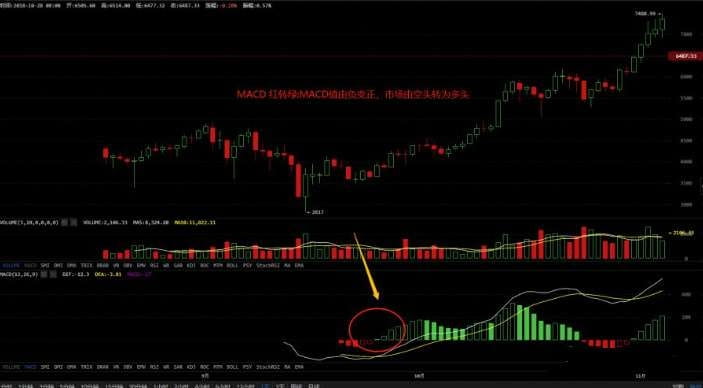
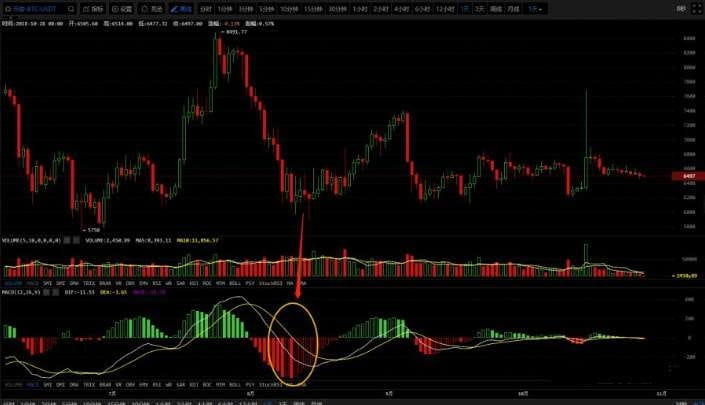
2. MACD Green to Red: The MACD value changes from positive to negative, and the market turns from bullish to bearish.
3. MACD Red to Green: The MACD value changes from negative to positive, and the market turns from bearish to bullish.
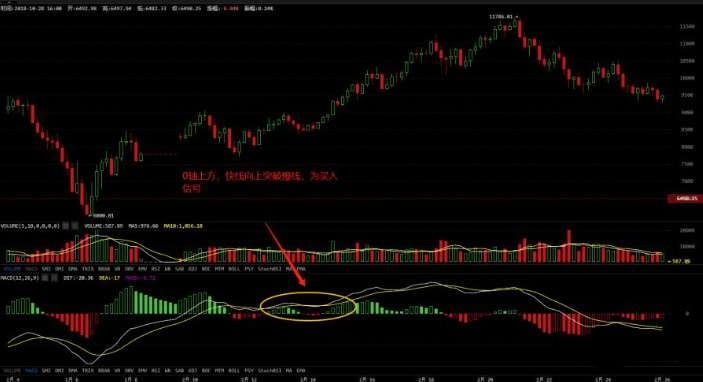
4. Both DIFF and DEA are positive, meaning both are above the zero axis, indicating a bullish market. When DIFF breaks above DEA, it serves as a buy signal, commonly referred to as a golden cross above zero.
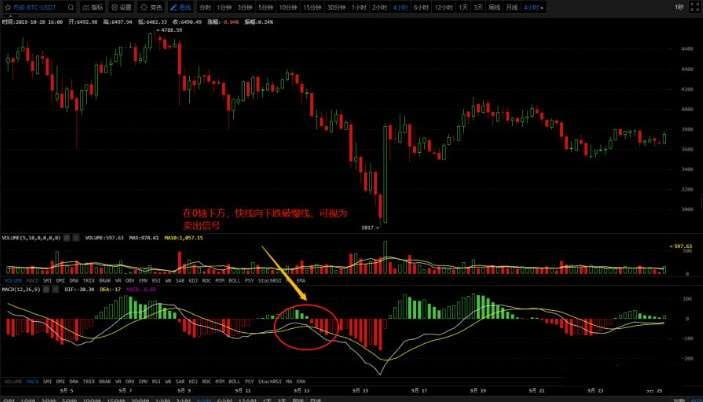
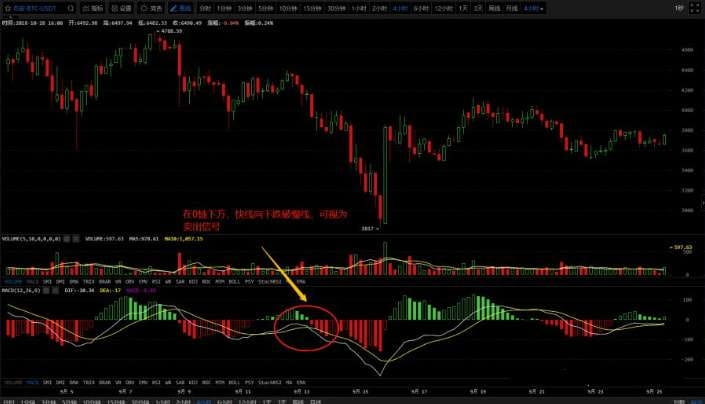
5. Both DIFF and DEA are negative, meaning both are below the zero axis, indicating a bearish market. When DIFF breaks down below DEA, it serves as a sell signal, commonly referred to as a death cross below zero.
Analysis of the Histogram in the MACD Indicator
1. When the green bars continue to expand, it indicates that the market is in an upward trend, and prices will continue to rise. At this time, one can continue to hold until the green bars can no longer expand before considering selling.
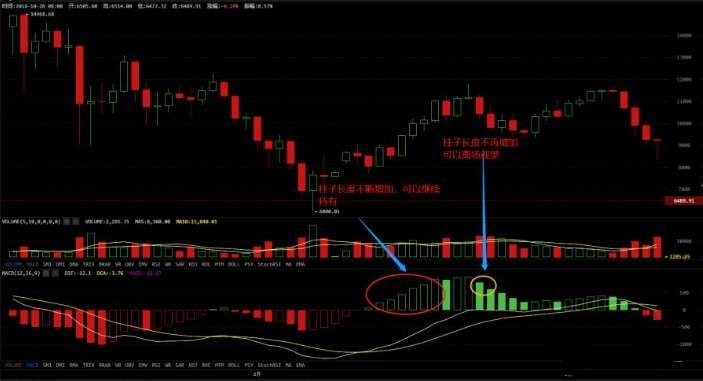
2. When the red bars continue to expand, it indicates that the market is in a downward trend, and prices will continue to fall. At this time, one should mostly watch until the red bars begin to shrink before considering building positions.
3. When the green bars begin to shrink, it indicates that the current market trend is about to end (or enter a correction period), and the price will experience a pullback. This is the time to consider taking profits on previous positions.
4. When the red bars begin to shrink, it indicates that the current downtrend is about to end, and prices may stop falling and move upward (or enter consolidation). At this time, one can consider building positions in small amounts rather than selling easily.
5. When the green bars begin to disappear and red bars start to appear, it indicates that the current uptrend or consolidation is about to end, and prices will experience a pullback.
6. When the red bars begin to disappear and green bars start to appear, it indicates that the current downtrend or consolidation is about to end, and prices will start to rise.
Top Divergence and Bottom Divergence
Divergence in the MACD indicator refers to a situation where the graphical trend of the MACD indicator moves in the opposite direction of the candlestick chart. There are two types of divergences in the MACD indicator: top divergence and bottom divergence.
(1) Top Divergence
When the price trend on the candlestick chart forms higher peaks but the MACD indicator composed of red bars shows lower peaks, this is called a top divergence phenomenon. Top divergence generally signals that the price is about to reverse from a high level, indicating that the price is likely to drop or adjust in the short term, serving as a sell signal.
(2) Bottom Divergence
Bottom Divergence generally occurs in low price areas. When the price trend on the candlestick chart forms lower peaks, while the MACD indicator shows higher lows, it indicates a bottom divergence phenomenon. This phenomenon generally signals a possible price reversal to the upside at low levels, suggesting a short-term buying opportunity.
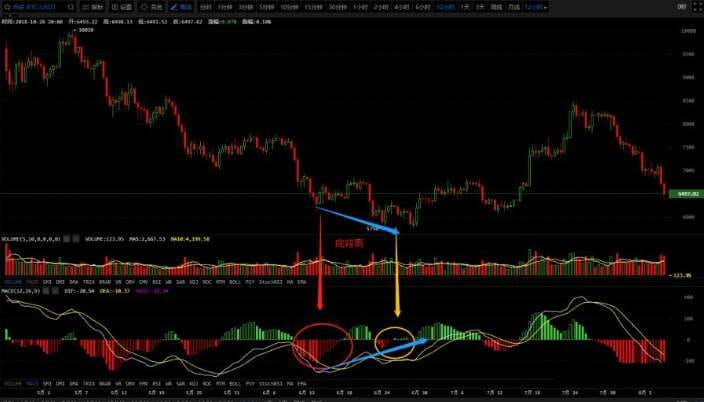
In practical applications, the divergence of the MACD indicator generally appears to be more reliable in strong market conditions. When prices are at high levels, usually only one divergence pattern is needed to confirm that the price is about to reverse. However, when prices are at low levels, multiple divergences may be needed to confirm. Therefore, the accuracy of determining top divergences using the MACD indicator is higher than that of bottom divergences.
Support and Resistance Levels
Let's first understand what support and resistance levels mean. Support refers to a point at which the price stops falling after reaching a certain level during a downtrend, creating a sense of support. Therefore, if you can predict the support level in advance, you won't panic as much when the market declines.
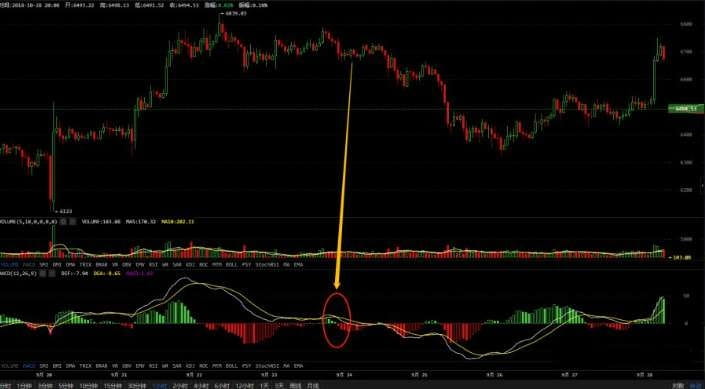
So how do we find support levels for cryptocurrencies? First, we need to understand the principle of support levels. The simplest principle of support and resistance levels is the【Intensive Trading Area】. What is an intensive trading area? It is the range where chips are densely concentrated and the trading volume is high. For example, let’s look at the EOS chart below.
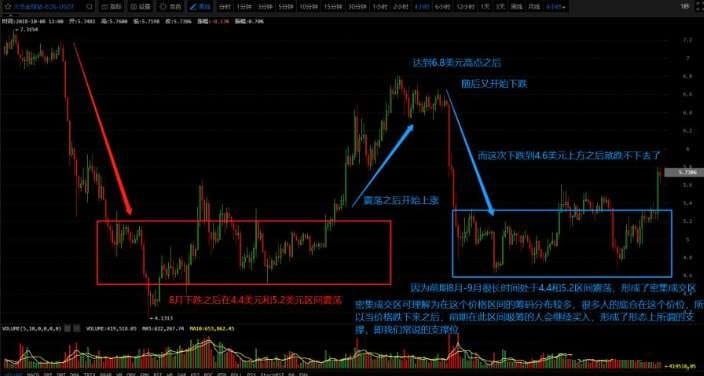
In fact, support levels can be understood as a range of intensive trading areas for previous prices. Looking at the chart of EOS, we also provided textual descriptions. After EOS dropped to around $4 in August, it began rising from August 27, reaching a peak of $6.8 before dropping again. The price stabilized directly around $4.7, forming another consolidation area visible in the candlestick chart.
This is also because in August, EOS experienced prolonged fluctuations in the range of $4.4 to $5.2. At that time, many people bought EOS at an average price of around $4.7. Therefore, when the market rose and subsequently fell back into the previous intensive trading area, it formed market recognition. This means that those who bought EOS at $4.4 to $5.2 in August would re-enter the market when EOS dropped back to that range in September, creating the support effect we observe.
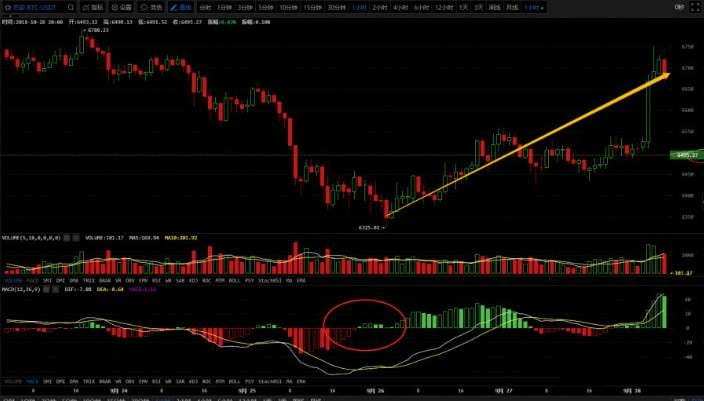
Similarly, let’s talk about the point where EOS dropped in the first wave in August. As we can see in the first chart, EOS dropped to around $4 in August. So why did it stop falling after hitting $4? Let's look at the next chart.
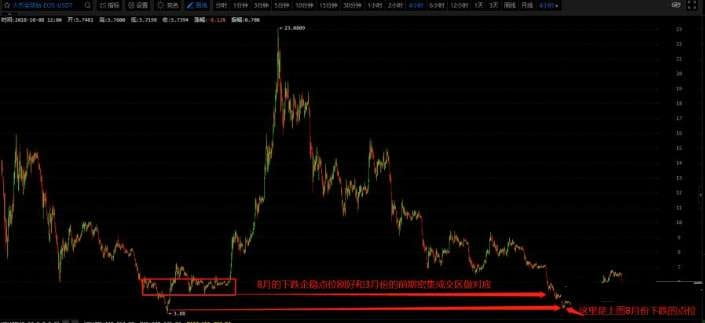
Why did EOS stabilize and stop falling when it dropped to around $4 in August? When we zoom into the candlestick chart, can we find the so-called intensive trading area? You will be pleasantly surprised to find that in March, EOS also fluctuated around $4 before starting a significant rally in April. Therefore, when the uptrend ends and the price drops to the initial point of the prior cycle, which is the intensive trading area from March, a trend support level is formed. Around August 15, when EOS dropped to around $4, it could not fall further, which is also the understanding of support in an intensive trading area.
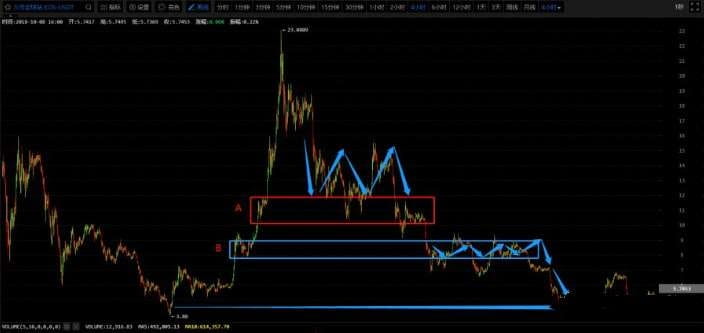
In fact, we can also look for ranges related to previous intensive trading areas during the previous downtrend, and everyone can find that every time the price falls to previous intensive trading areas during a downtrend, a temporary support is formed. Therefore, the understanding of support can be directly understood as the meaning of previous intensive trading areas. Comparing the current market with previous intensive trading areas, these are some basic concepts summarized by our analyst that are easy to understand and practical.
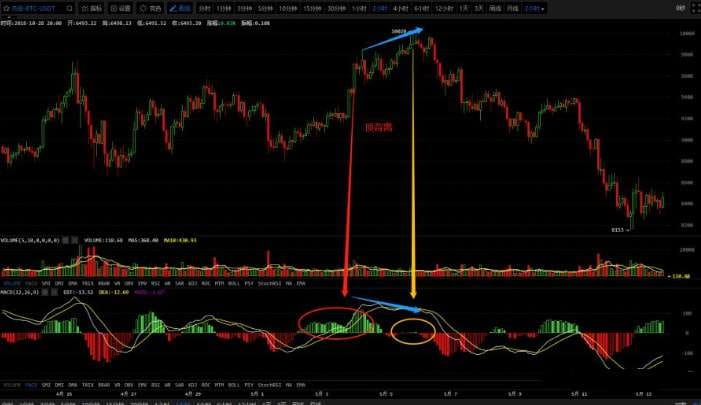
After discussing support levels, let’s talk about resistance levels. In fact, once you understand what we mentioned above, understanding resistance levels becomes very easy. Resistance levels are analogous to support levels. Let’s continue to look at the EOS candlestick chart, still using the first chart to mention that after EOS stabilized when it dropped to around $4 on August 15, it formed an upward trend on August 27. You can also see that this was when we proposed the conspiracy theory. When EOS rose to around $6.8, it got stuck and couldn't rise further. Was it pressured by the resistance level? Let’s look for previous intensive trading areas.
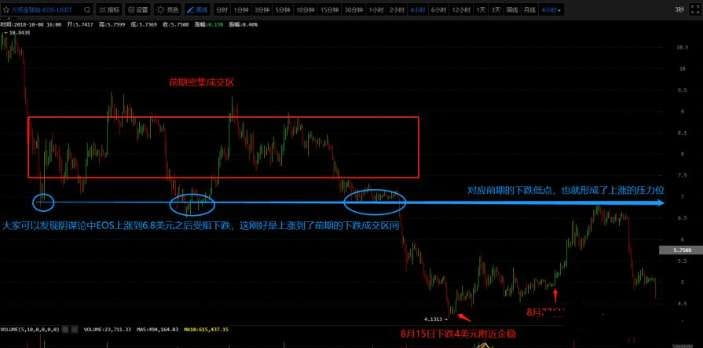
After the conspiracy theory, EOS started a brief rise, reaching $6.8 before encountering resistance and dropping. We can see that around June 25, July 13, and August 5, EOS hit approximately $6.8 three times, indicating that there are many chips at this bottom. After EOS broke below the $6.8 support level on August 8, many funds were trapped. It was not until early September that EOS rose back to $6.8. When EOS reached $6.8, the corresponding previous intensive trading area at $6.8 acted as a pressure level, as many people were trapped before, leading to selling pressure when the price returned to that level.
Thus, the principles of resistance and support are the same. Support is found by looking for previous low intensive trading areas in a downtrend, while resistance is found by looking for previous high intensive trading areas in an uptrend. These are some of the principles of technical indicators, and we hope to convey these principles to everyone so that you can learn to judge support and resistance levels on your own in the future.
Trend Indicators
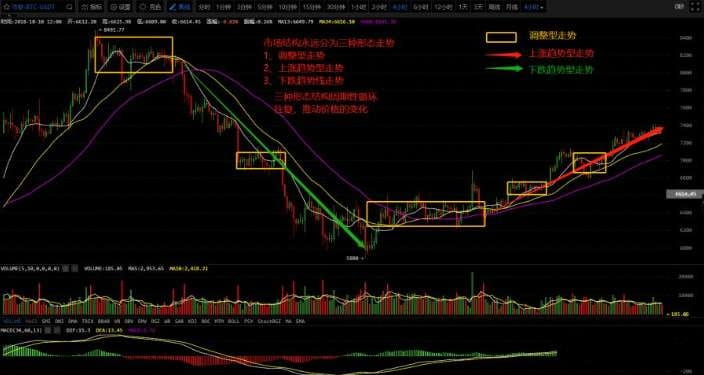
1. Structure of the Market
First, let’s look at the types of market structures: 1. Trend types, 2. Adjustment types. Trend types are further divided into upward trends and downward trends, while adjustment types refer to price fluctuations within a range, commonly known as a consolidation range.
2. Definition of Trend
What is a trend? It refers to the price operating in a certain direction for a prolonged time.
An uptrend is characterized by a continuous increase in price over a prolonged period.
A downtrend is characterized by a prolonged period of price continuously reaching new lows, indicating a consistent decline.
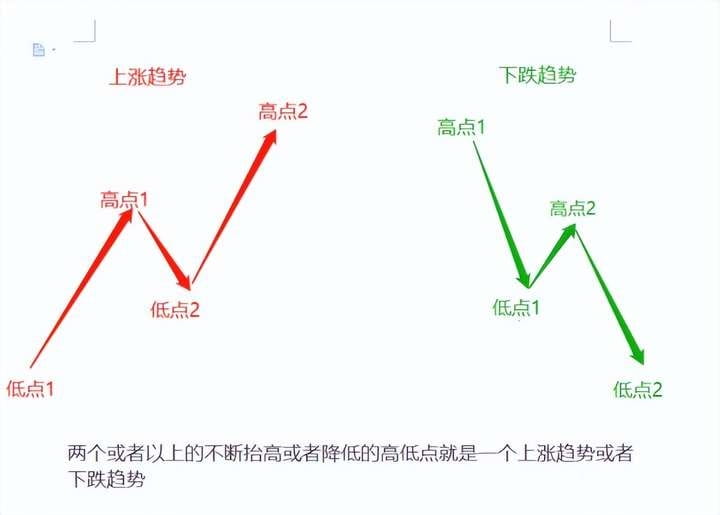
3. Structure of Trends
The structure of a trend consists of upward, downward, and adjustment phases, as can be referenced in the chart below.
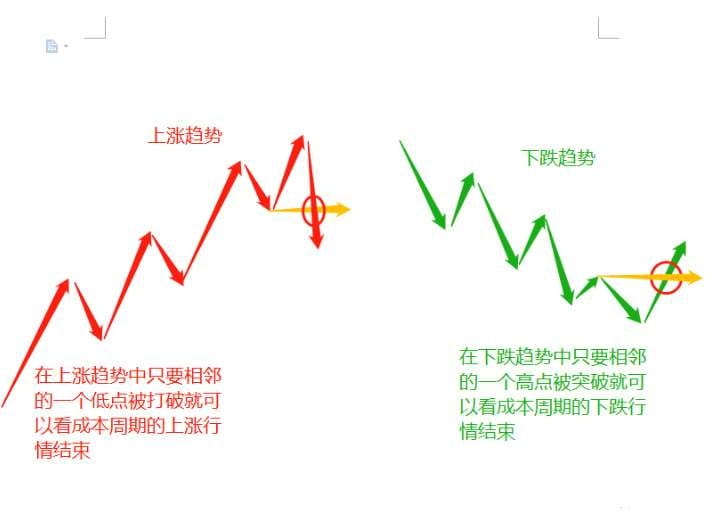
4. The End of a Trend
The end of a trend is generally marked by the effective breaking of two adjacent supports or resistances.
5. Levels of Trends
Trends exist across any time frame; there can be a certain trend in 1 minute, 5 minutes, 15 minutes, 1 hour, 4 hours, daily, weekly, monthly, and yearly charts.
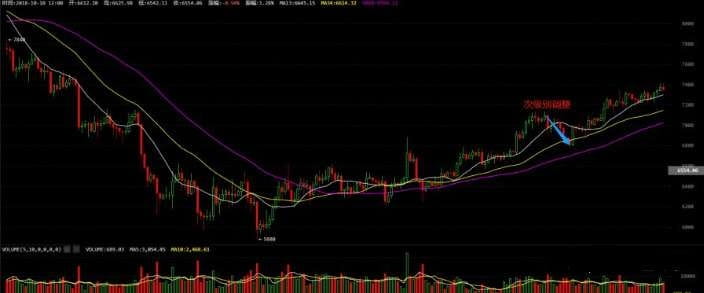
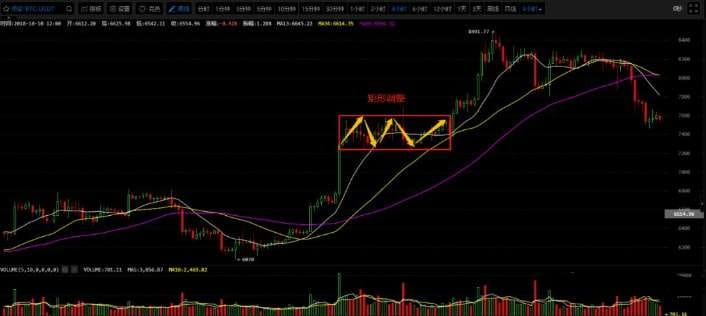
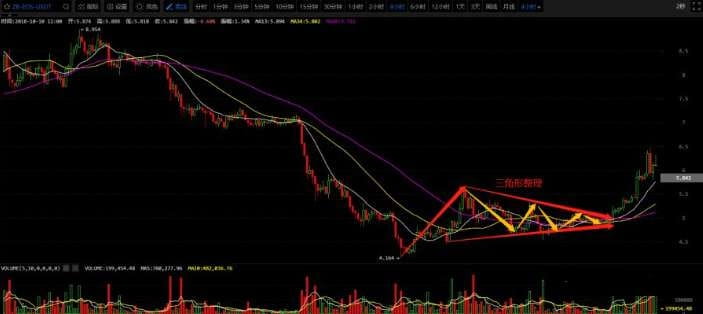
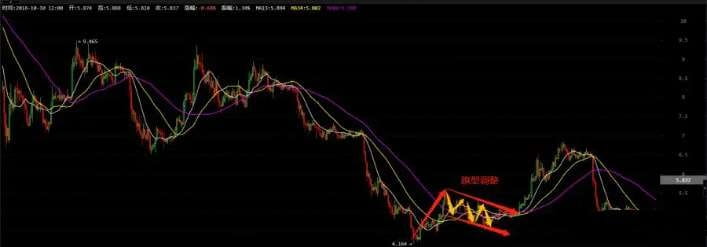
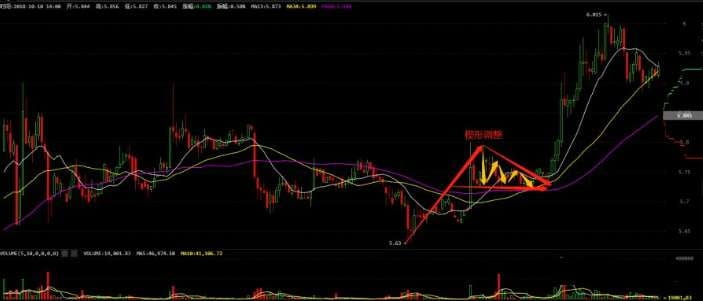
6. Trend Adjustment Patterns
Trends include correction patterns; a trend is simply a phase of upward or downward movement, while a corrective movement is somewhat more complex. To make it easier for everyone to understand, we categorize corrective movements into several common forms, such as: a secondary wave adjustment pattern, rectangular adjustment pattern, triangular adjustment pattern, flag adjustment pattern, and wedge adjustment pattern, as listed in the following diagram.
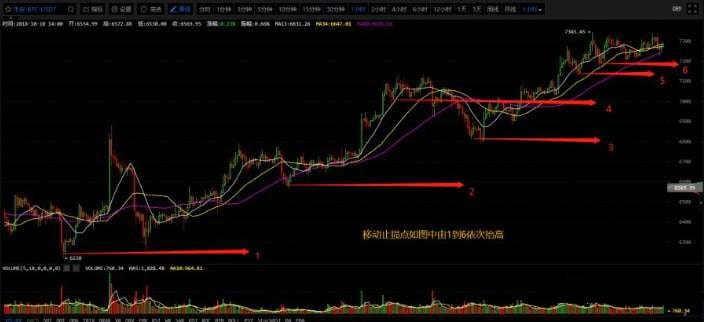
7. Exit Points in Trend Markets---Follow the trend with a trailing stop loss;
By following the trend with a trailing stop loss, you can maximize trend profits; the longer the trend continues,
Volume-Price Relationship Indicators
What is trading volume? Trading volume is a reflection of market sentiment; when market sentiment is good, trading volume is relatively high, and vice versa. So what are the relationships between volume and price? They can be categorized into five situations: volume increase with price stability, volume increase with price increase, volume shrinkage with price increase, volume increase with price decrease, and volume shrinkage with price decrease. Let’s discuss the impacts of these five situations on future markets.
Volume Increase with Price Stability: Price changes little while trading volume begins to increase. This trend may indicate that funds are suppressing positions or selling. Once the price reverses upward or downward in effective coordination with trading volume, it indicates the formation of a bottom or top.
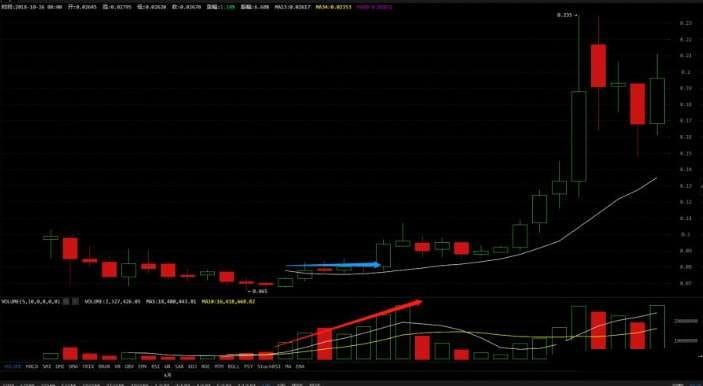
From the above chart, we can clearly see that after the previous drop, the volume suddenly began to increase, while the price remained relatively stable. After adjustment, a wave of upward trend began, confirming the formation of a relative bottom.
Volume Increase with Price Increase: Trading volume and prices rise simultaneously, representing a volume-price coordination phenomenon. Volume increase with price increase only occurs in an uptrend, mainly at the beginning of the uptrend, with some occurrences in the middle. It indicates that the market will continue to rise.
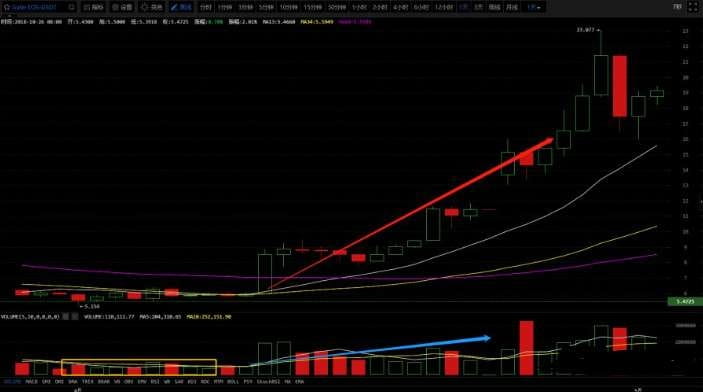
In the above chart, we can also see that both volume and price are continuously increasing, leading to an ongoing market trend.
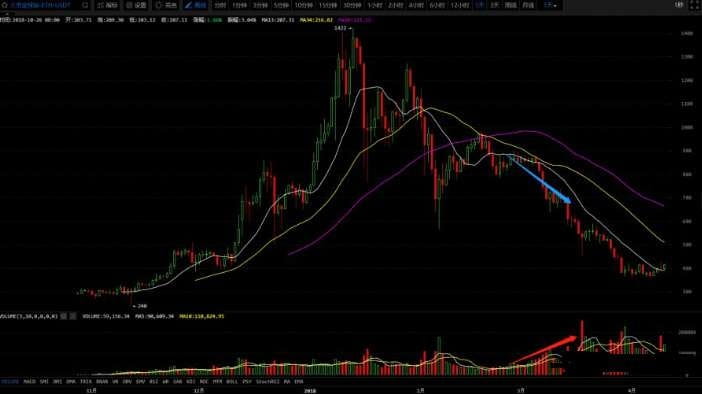
Volume Shrinkage with Price Increase: Trading volume begins to weaken while prices continue to rise. This phenomenon often appears at the end of a rising market and occasionally during the rebound of a falling market. In a sustained uptrend, moderate volume shrinkage with price increase indicates a high degree of control by the main force, with a large number of circulating chips locked by the main force. Therefore, if trading volume expands again during the subsequent upward process, it may indicate that the main force is offloading at a high point.
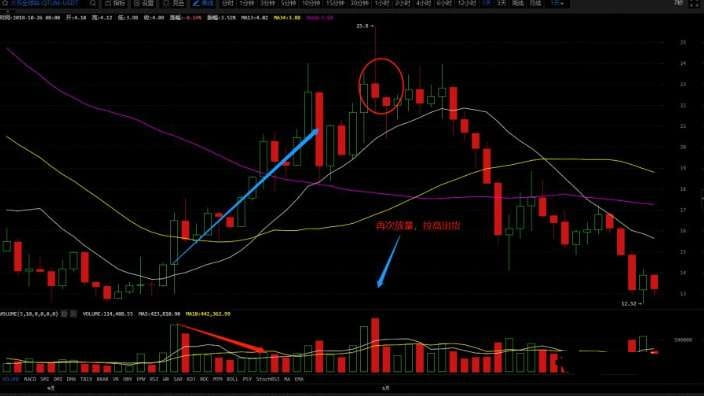
The above chart shows that after volume shrinkage, the price continues to rise, and finally, after a new round of volume expansion, the market begins to reverse, continuing the initial downtrend.
Volume Increase with Price Decrease: Trading volume increases while prices begin to drop. After a significant price increase, there are more profit-taking chips in the market, leading investors to sell off, causing prices to start falling. This high-volume increase with price decrease is a sell signal.
In the above chart, we can see that after the previous price increase, the trading volume gradually began to increase, indicating clear signs of selling, so we can interpret volume increase with price decrease as a signal of large funds offloading.
Volume Shrinkage with Price Decrease: Trading volume decreases while prices begin to fall. This phenomenon can occur in both the mid-phase of a downtrend and an uptrend. In a downtrend, volume shrinkage with price decrease indicates that investors are no longer doing "short covering" after offloading (having previously been bearish and waiting for price stabilization before re-entering), leading to a continued price drop. In an uptrend, it may indicate that part of the profit-taking funds are exiting, and when funds re-enter, the price will continue to rise.
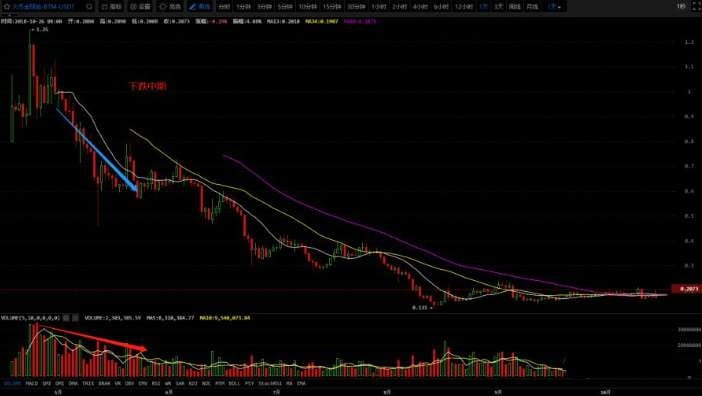
The above chart shows the volume shrinkage with price decrease in a downtrend, as investors' willingness to sell is very firm, with no one wanting to buy again, so the price will continue to drop.
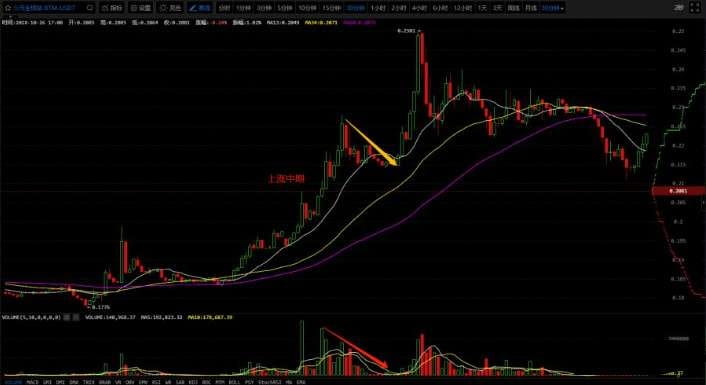
The above chart shows volume shrinkage with price increase in an uptrend, which we usually refer to as a pullback, and prices will continue the upward trend.
The main manifestations of volume-price divergence are volume shrinkage with price increase and volume increase with price decrease.
Finally, it is important to remember that adhering to trading iron rules is a strong defense for safeguarding wealth and rationality.
"The smoke of the battlefield never spares the bloodied warrior; the world of trading is harsher than the battlefield—there are no medals, only the legends of survivors. When I see countless traders fall by their own swords, I finally understand: the true weapon is not candlestick strategies, but the survival iron rules engraved in one's marrow."
【First Commandment: Hell of Position】"Do you think being heavily invested is a direct path to wealth? No, it’s a roller coaster ride to hell! When leverage becomes a noose, even the most precise judgment will become a noose swinging on the gallows. Remember, the tolling bell of liquidation often starts the moment you press 'buy with all funds.'"
【Second Commandment: The Curse of Exhaustion】"Caffeine at three in the morning won't save your account; bloodshot eyes can't see the truth of trends. Exhaustion is the most effective poison of the market's devil, making you mistook stop-loss for take-profit and opportunities for traps. Remember, traders who collapse on their keyboards will never see the dawn of enlightenment."
【Third Commandment: The Advantage Principle】"Trading without core competitiveness is like charging into a hail of bullets unarmed. Ask yourself: If you could describe your winning logic in one sentence, is that sentence sharp enough? Simple enough? Enough to make your opponent tremble? If not, you are just a lamb waiting to be slaughtered at the betting table."
【Fourth Commandment: The Poison of Boredom】"Opening a position out of loneliness will inevitably lead to demise due to greed. The market will not compensate your fingers for their loneliness; it will only teach you what it means to 'endure loneliness' through losses. A true hunter can turn their empty positions into moments of sniping, making every trigger pull shatter their opponent's eardrums."
【Fifth Commandment: Staring into the Abyss】"Revenge trading after a big loss is like throwing stones into the abyss and expecting an echo. The market will never compensate for blood and tears; it will only mock your weakness with deeper losses. Remember, when you stare into the abyss of losses, the abyss is also staring back at you—until it drags you into the bottomless pit."
【Sixth Commandment: Escape Route】"Every trade should have an escape route; a stop loss is not a shackle, but a parachute. Before greed devours reason, before fear distorts judgment, let the plan make the coldest decisions for you. Remember, a position without a backup plan is like a tightrope over a cliff."
【Seventh Commandment: The Obsession that Burns the Heart】"The market never makes way for obsession; your beliefs are nothing but dust in front of the market. When losses turn into the spark of obsession, failing to stop loss in time will lead to your own demise. Remember, trading is not a shrine of belief, but a battlefield of rationality."
【Eighth Commandment: The Rearview Mirror Trap】"Trading by fixating on profit and loss numbers is like a driver staring at the rearview mirror. The past has become a tombstone; the future is the battlefield. A true trader can keep their gaze fixed on the front of the trend, allowing every decision to penetrate the fog."
【Ninth Commandment: Signal Filtering】"Every day the market generates countless noises, and the real signals are hidden in the eye of the storm. Cultivate an iron-like focus, let the bullets fly for a while longer until you see the prey worth pulling the trigger on."
【Tenth Commandment: The Tide of Trends】"Fighting against the trend is like trying to stop a mudslide with your body. Smart money always stands with momentum, harvesting the market with minimal resistance. Remember, true profits come from the magic of compound interest by going with the trend."
【Eleventh Commandment: The Fog of Value】"A decline is not a badge of value, but possibly the tolling bell of value destruction. True value investing requires penetrating financial statements to see the spring of free cash flow rather than picking up cigarette butts in a junkyard."
【Twelfth Commandment: The Holy Scriptures of Discipline】"Trading discipline is a sanctuary built with blood and tears; every breach during emotional turmoil destroys one's throne. Remember, professional traders are not genius prophets, but priests of rule enforcement. Plan your trades and trade your plan—this is the only path to redemption in the trading world!"
【Final Scene: The Battle Song Fades】"When the market closing bell rings, may these iron rules become your armor. Remember, trading is not a casino for overnight wealth, but the ultimate training ground for cognition and discipline. Only those traders who engrave these iron rules into their DNA can traverse bull and bear markets, becoming eternal survivors in the market."
Even the most diligent fisherman wouldn’t go out to sea during a storm but would carefully guard their fishing boat. This season will pass, and a sunny day will eventually come! Pay attention to banquet safety; we will teach you both fishing and how to fish. The door to the cryptocurrency world is always open; only by going with the trend can you live a life in harmony with it. Keep this in mind!