Partial Conclusions The market enters a critical selection period Long-term Bullish
1. Ancient whales' transfers disrupt on-chain data, but in reality, it is still an accumulated trend.
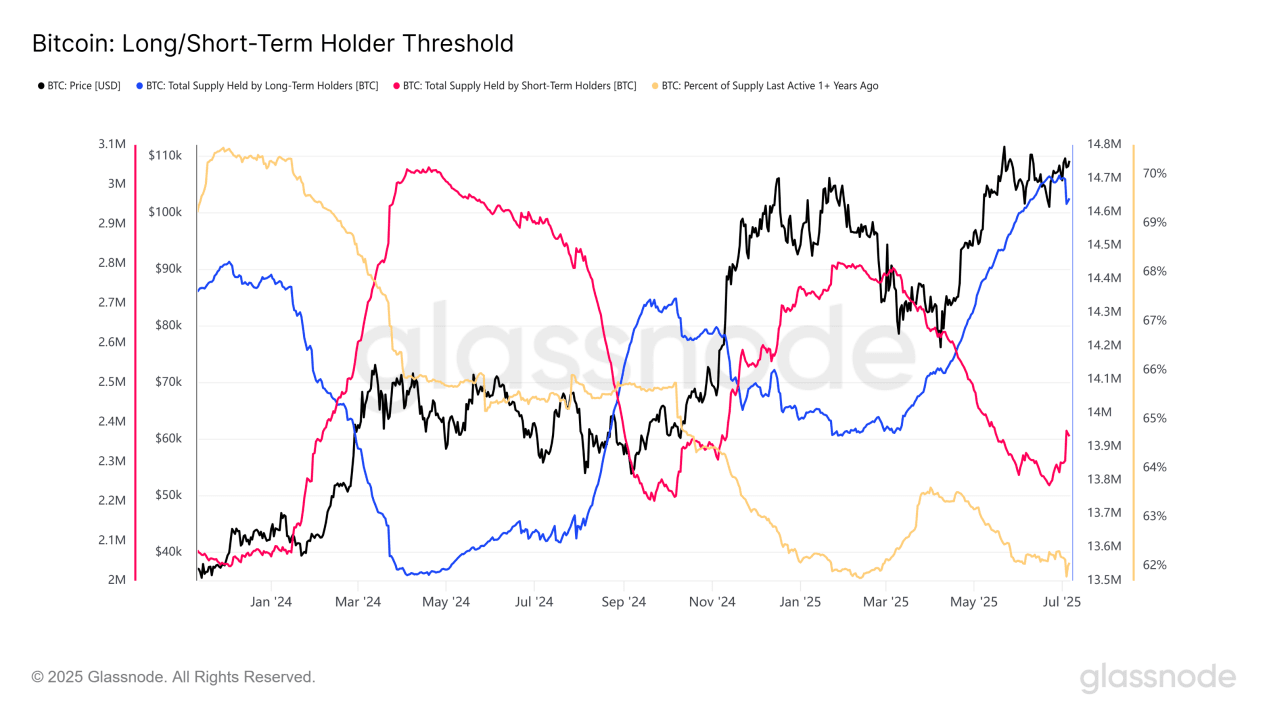
This week's on-chain data shows that long-term holders 'sold' 57,000 BTC, but 80,000 BTC of that came from one ancient whale's address, meaning that no actual chip turnover occurred. After excluding that factor, the market still achieved a net accumulation of about 23,000 BTC, and the long-term structure remains strong.
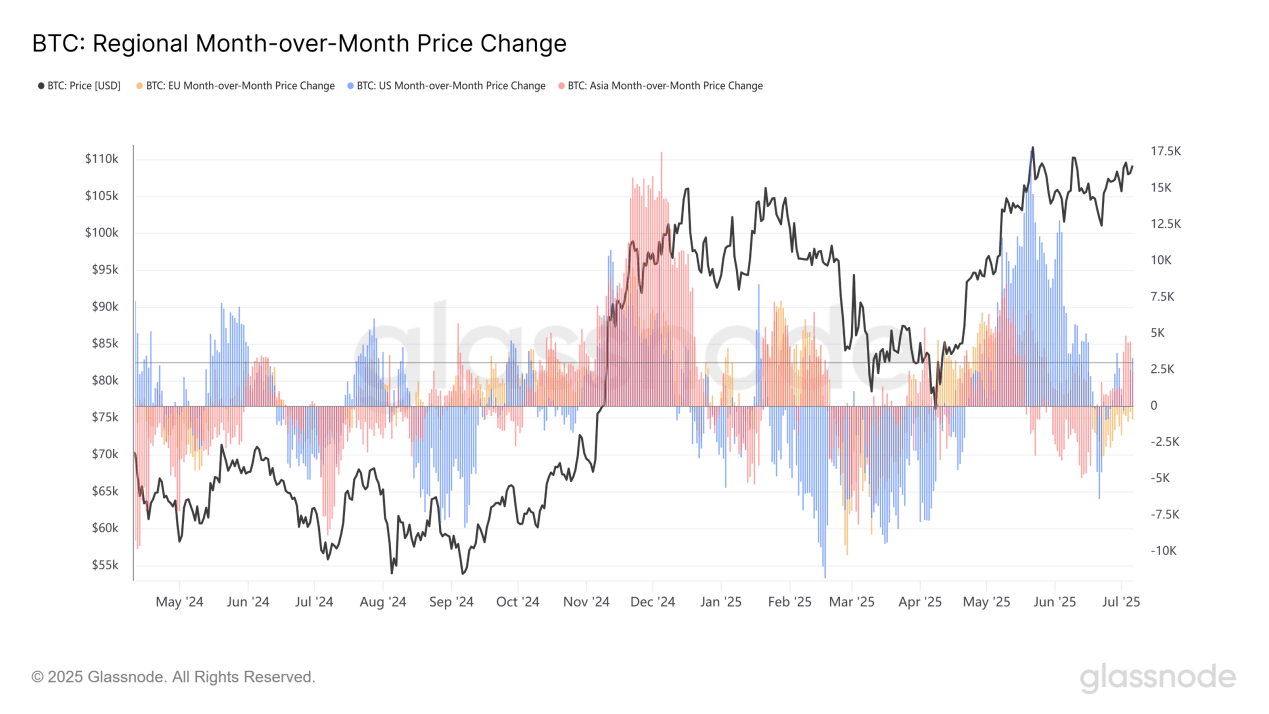
2. Asian sentiment warms up to dominate short-term momentum, while American confidence is insufficient.
This week, sentiment in the three major trading time zones has rebounded, with Asian investors being the most active, providing short-term momentum for the market; however, sentiment among American investors remains weak, and a short-term rebound has yet to form a consensus.
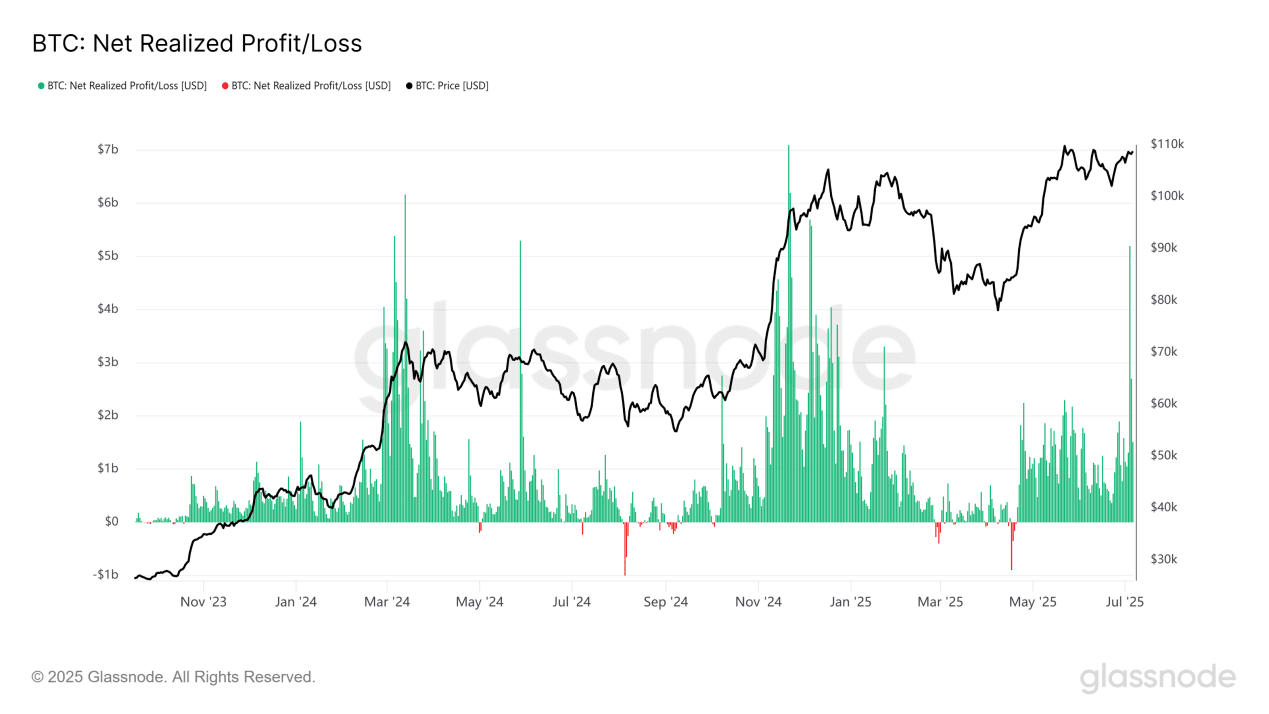
3. The on-chain liquidation curve has failed; abnormal profits are disturbed by whales.
Due to the extremely low cost of ancient whales, their transfers are recorded as massive profit realizations, leading to the failure of the on-chain liquidation curve this week, distorting data trends and reducing the reference value of short-term behaviors.
Holding Period Storm Chart Long-term Bullish
This week, long-term holders sold about 57,000 BTC and now hold approximately 14.64 million BTC, indicating a rapid decrease in holdings, seemingly signaling large-scale distribution. However, the reality is that this is primarily due to one ancient whale (80,000 BTC) pooling. It is likely that no actual chip turnover occurred. The operations of this whale can be monitored using on-chain tools: https://intel.arkm.com/explorer/entity/dd59af4d-5575-4b38-9171-15a6775b8ac8. This operation has significantly interfered with on-chain data, making recent trends unclear. However, after excluding the 80,000 BTC transferred by this whale, the week still seems to have shown an accumulation trend, accumulating about 23,000 BTC, and the accumulation trend has not been broken.
BTC Global Momentum Radar Chart Short-term Bullish
The market generally views the sentiment of American investors as a leading indicator—when American sentiment warms up, the BTC price often strengthens afterward; Asian investor sentiment is often seen as a contrarian indicator: if Asian sentiment rises while American sentiment declines, BTC is highly likely to reach a peak in the short term. In contrast, the European market represents more of the medium to long-term flow of substantial capital.
This week's data reflects varying degrees of sentiment rebounds among investors in the three global time zones, with Asian investors as the main force providing momentum for the market. However, sentiment among European and American investors is not very high, especially among American investors, who appear somewhat unsteady. Nonetheless, there are currently no signs of a peak or decline.
On-chain Liquidation Curve Indicator Failure
Due to the ancient whales, the on-chain liquidation curve has also shown abnormal conditions. Such a massive profit realization would usually only occur in a primary uptrend; however, now, due to the very low cost (around $0.8) of UTXO changes, massive profit realizations have occurred, making it difficult to observe this week's trend due to noise, resulting in indicator failures.
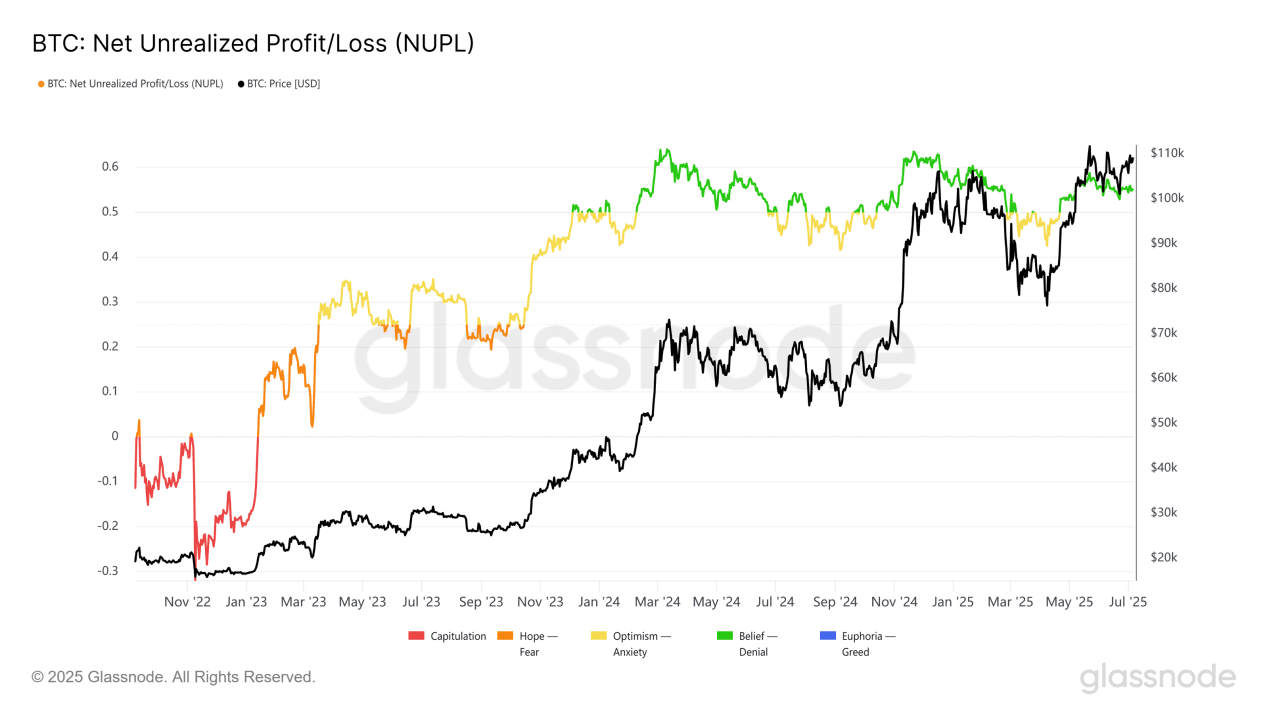
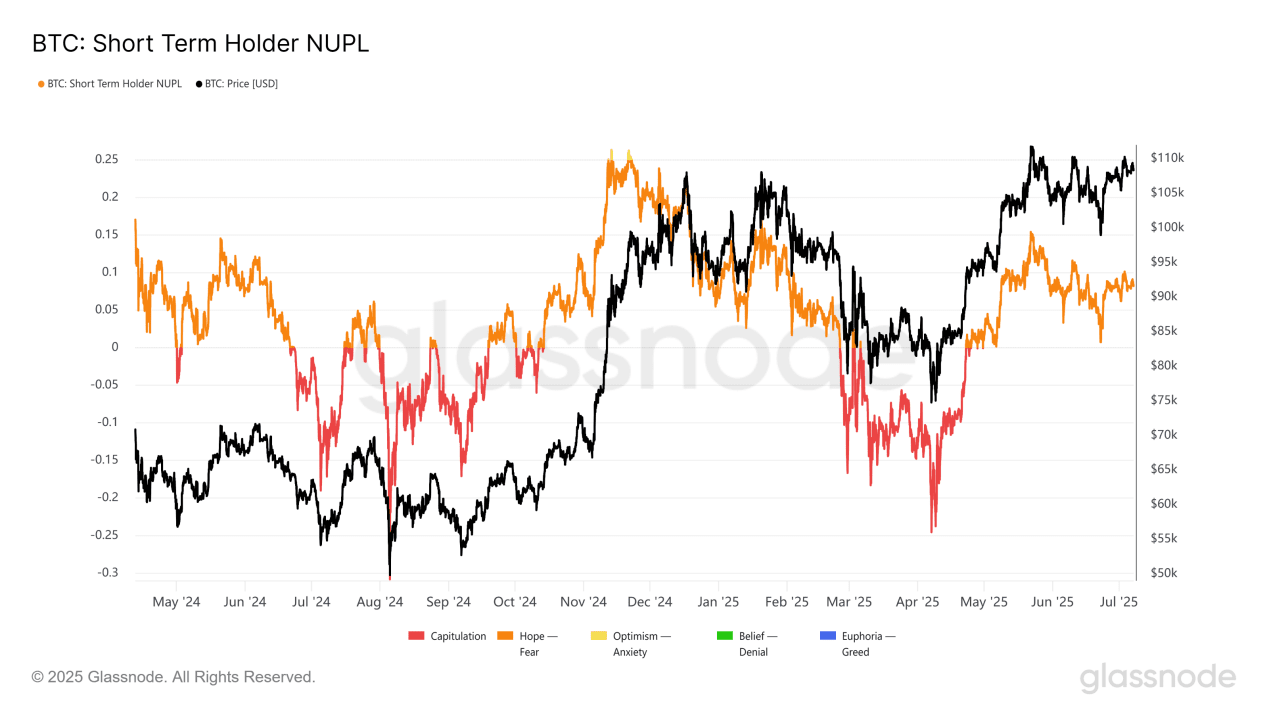
On-chain Illusion Research Instrument Short-term Bearish Long-term Bullish
Currently, the average profit rate of all chips in the market remains around 52%. Fortunately, in this on-chain indicator, the ancient whales' UTXOs have not been included in the statistics, so no abnormal conditions have occurred. The overall structure is still at a high level, and the unrealized losses of short-term holders have not escaped the declining trend, still showing a trend of lower highs and lower lows. Investors should be wary of downside risks.
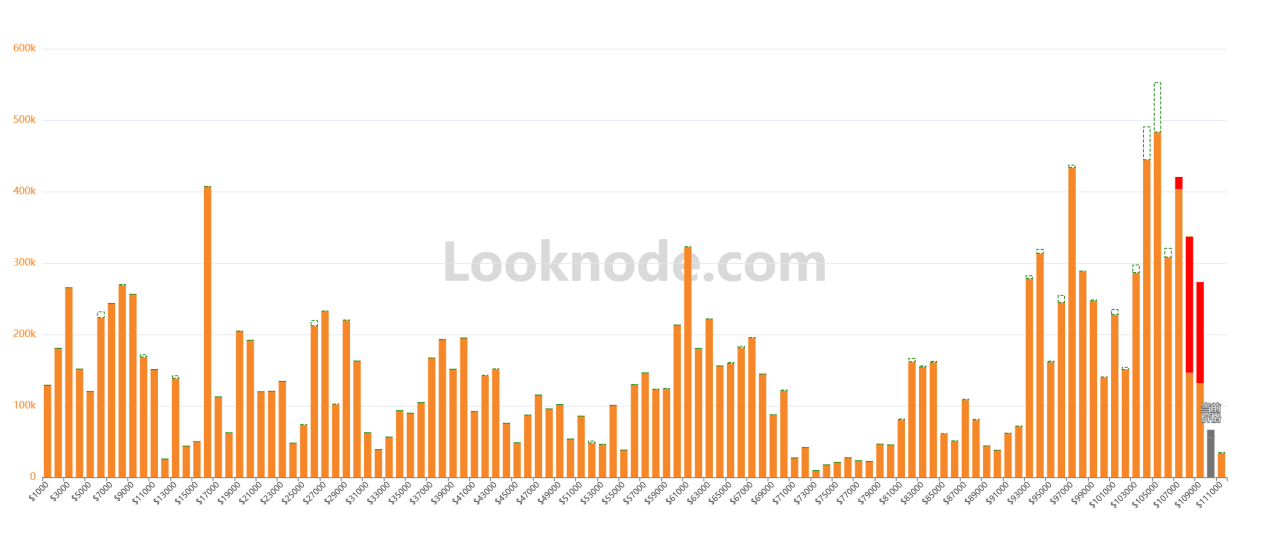
UTXO Energy Band Long-term Bullish
Ancient whales' new UTXO accumulation is around the $109,000 price range. It can also be observed that if this smokescreen is excluded, this week's turnover rate is extremely low, primarily consisting of small-scale turnover near the front end. It feels like the calm before the storm; if the demand and liquidity for short positions do not show significant improvement, it is a very dangerous signal for the short-term market. Attention should be paid to whether the support level of $108,000 can hold.
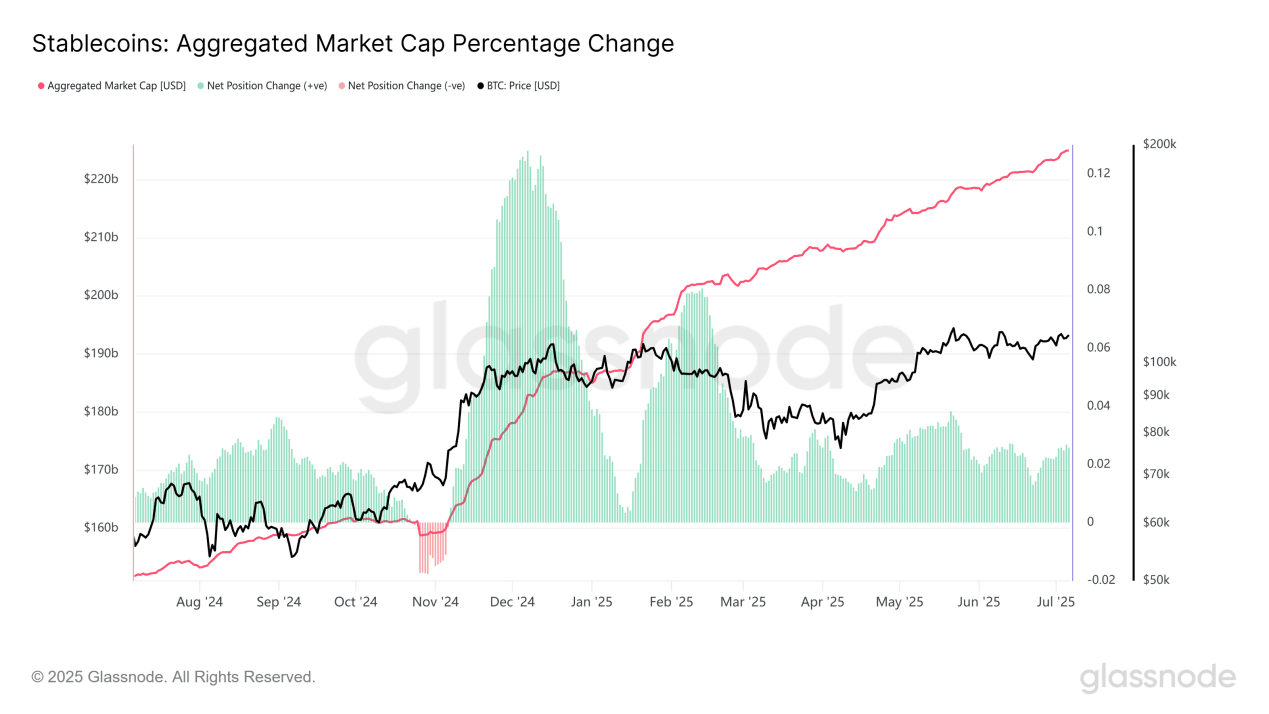
Liquidity Pulse Chart Short-term Bearish
This week's stablecoin issuance and inflow to exchanges remain sluggish. In past primary uptrends, this was often accompanied by a large amount of stablecoin issuance and inflow to exchanges, reflecting an increase in trader demand and market heat. Currently, there is no sign of similar liquidity improvements, but there hasn't been a large outflow of stablecoins from exchanges, which indirectly confirms that investors still have a bullish mindset.