Don't think stability is so sacred. I have been doing this for 10 years, and I have been working full-time for 7 years. I live a free and easy life. There is no pressure. The income from stable profits is definitely much better than that of ordinary office workers. But this income is also limited. It is not like many people want to get all the wealth in the world.
It took me 7 years to figure out a trading system that suits me, and it was only with the guidance of an expert that I finally became enlightened! Although I am not rich at the moment, I have achieved stable profits, at least I can steadily outperform more than 90% of people.
I have known for a long time that an excellent trading system can effectively help investors to invest. I also know that without a trading system, investing without rules is doomed to lose more than win. But it is really difficult to summarize a trading system. An excellent trading system is also anti-human. It requires you to overcome greed and fear, be decisive, not make subjective assumptions, and strictly implement it.
In the cryptocurrency circle, many newcomers may not know how to read trends, and they only know a little bit. There are even fewer people who can see the details and technical forms. As the saying goes, one trick can do it all. It is not difficult to master a technique that you can understand. The difficulty lies in not wanting to learn. Speculating in cryptocurrencies is not for others, but for yourself. If you are willing to spend more time, learn it well, and understand it thoroughly, then speculating in cryptocurrencies will not be as difficult as you think.
Before talking about technical tactics, I also strictly follow the following 10 iron laws to understand the tactics:
1. Popular coins in the bull market fall the fastest
Those coins that are hyped up, especially those with serious market control, often burst quickly. The more coins that attract a large number of retail investors to chase the rise, the greater the risk. Just like blowing a balloon, the bigger it is, the faster it bursts. Hot coins in a bull market are often the favorites of short-term speculators, but they are also the traps that are most likely to make people lose all their money. Suggestion: Don't blindly chase the rise, especially those coins that have risen sharply in a short period of time. Stay calm and avoid becoming a "taker".
2. The strategies of altcoins are similar
The way to play with altcoins is usually to smash the market first to create panic, then slowly push it up to attract retail investors, and finally change the way to continue harvesting. This routine has been tried and tested, and novices can easily be cut off. Suggestion: For altcoins, you must be mentally prepared, don't be confused by short-term gains, and don't easily hold a large position.
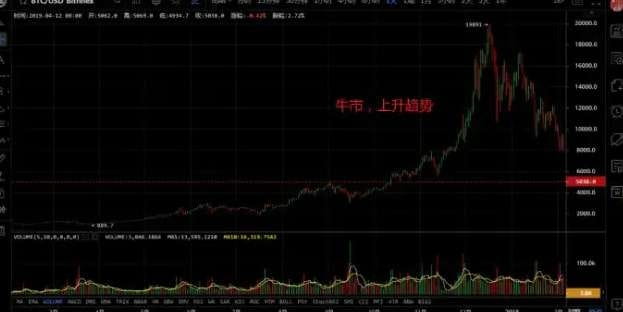
3. The long-term market trend is upward
Although the cryptocurrency market has experienced sharp fluctuations in the short term, the overall trend is upward if we look at the long term trend. The historical trends of mainstream currencies such as Bitcoin and Ethereum have proven this. Suggestion: If you are a long-term investor, don’t be scared by short-term ups and downs. Hold high-quality assets patiently, and time will pay you back.
4. No one is hyping up coins with potential
Coins with real potential are often unknown at the bottom and rarely mentioned. Coins that are hyped up are often used by dealers to harvest. Low-key coins may quietly explode at some point. Suggestion: Pay more attention to projects with solid technology and reliable teams that have not yet been hyped by the market. They may be the dark horses of the future.
5. Be careful with newly launched coins
Newly listed currencies on exchanges, especially those that have skyrocketed and plummeted, are often traps designed by market makers. Such currencies usually have no actual value support and are purely for profiteering. Suggestion: For new currencies, especially those that have huge fluctuations in the early stage of listing, be vigilant and do not enter the market easily.
6. Ups and downs are common
It is normal in the cryptocurrency world that prices fall when you buy and rise when you sell. The market is extremely volatile, and short-term ups and downs cannot fully reflect the value of a project. Suggestion: Keep a positive attitude and don't panic because of short-term fluctuations. Develop your own investment strategy and strictly implement it.
7. The strongest rebound does not represent potential
The coins that rebound the most are often not the ones with real potential, but the ones that are hyped up for speculation. The rise of such coins usually lacks fundamental support, and they rise quickly and fall quickly. Suggestion: Don't be confused by short-term surges. The coins with real potential usually fluctuate more steadily and have an upward trend in the long term. #香港稳定币条例
8. Be careful of being cut by sudden callback
If the coin you bought suddenly pulls back after a surge, this may be a signal that the dealer has started to sell. The dealer usually attracts retail investors by raising the price, and then sells at a high price. Suggestion: When encountering a sudden pullback, stop profit or stop loss in time to avoid becoming the dealer's "taker".
9. Coins that exploded in the second half
In a bull market, currencies that performed mediocrely in the early stage may explode several times or even more in the second half. Such currencies are like marathon runners, accumulating strength in the early stage and exerting strength in the later stage. Suggestion: Do not ignore those currencies that performed mediocrely in the early stage but have solid fundamentals, as they may be dark horses in the later stage of the bull market. #币安HODLer空投LA
10. Coins that have been sideways for months may explode
In a bull market, some currencies may go sideways for several months after experiencing several times of growth. This sideways trend is usually a sign that the market makers are accumulating strength and waiting for the next opportunity to explode. Suggestion: Keep an eye on currencies that have been sideways for a long time, as they may be the protagonists of the next round of market.
So how do you do cryptocurrency trading well? Once you enter the financial market, it is difficult to turn back. If you are losing money now but are still confused, and you plan to make cryptocurrency trading your second career in the future, you must know the "simplest trend strategy". Reading and understanding it thoroughly will definitely help you avoid many detours. These are all personal experiences and feelings. It is recommended to collect and ponder over and over again!
1. What is a trend (financial term):
Trend is the direction of market movement, whether it is rising, falling or sideways. Trend is a regular conclusion obtained by observing financial trading markets (such as stocks, futures, foreign exchange, currency markets, etc.). Changes in buying and selling decisions shape different forms of trends. Trends always run in the direction of least resistance in the market. Finding trends is to find the direction of least resistance. Financial trading masters generally advocate that traders follow trends.
According to Dow Theory, any trend will eventually come to an end, which means that a bull market must be followed by a bear market, and the cycle repeats. Market prices will not rise in a straight line in one direction. The trajectory of trend movement is like a wave that follows one after another, with clear peaks and troughs. #SECETF审批
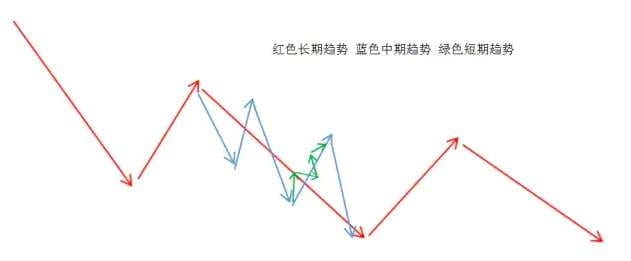
Peaks and troughs are the basic elements that make up different trends. According to the different positions of peaks and troughs, they can be divided into: rising trend, falling trend, and oscillating trend.
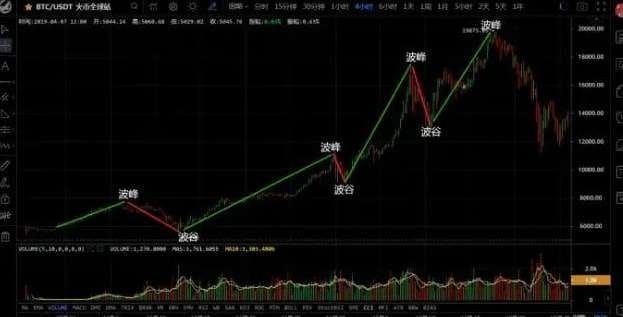
1. Upward trend:
Judgment basis: Both the peak and the trough gradually rise.
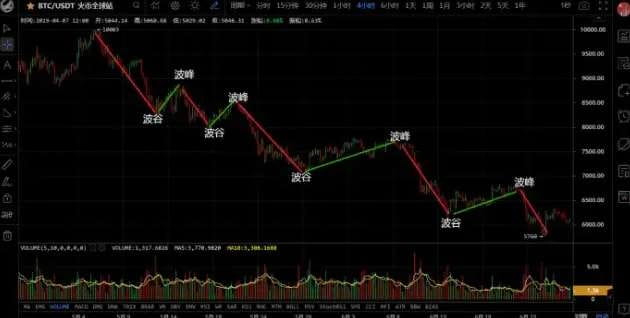
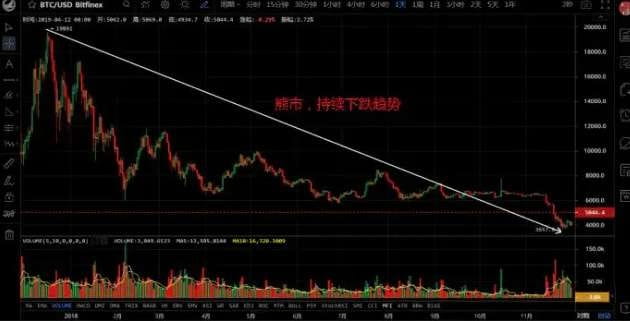
2. Downward trend:
Judgment basis: Both the peak and the trough gradually decrease.
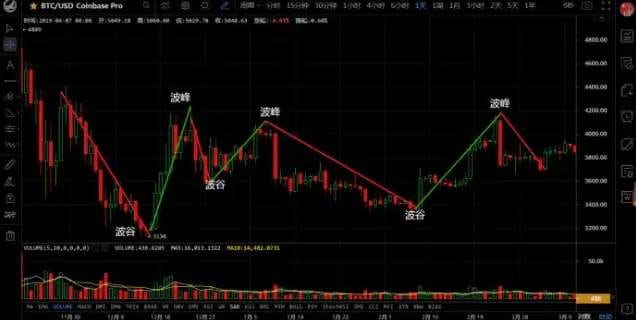
3. Oscillating trend:
Judgment basis: The peaks do not rise regularly, and the troughs do not fall regularly. There is no clear rising or falling pattern for the peaks and troughs. In special forms, the peaks and troughs can be on the same horizontal line.
2. Classification of trends:
1. According to different time periods, it is usually divided into short-term trends, medium-term trends and long-term trends.
The trend within a few days is called a short-term trend, and short-term trading mainly refers to the cycle.
The trend of several days to several weeks is the medium-term trend, and the medium-term operations mainly refer to the cycle.
Trends that last from several months to several years are long-term trends, and long-term trading mainly refers to cycles.
Multiple short-term trends make up a medium-term trend, and multiple medium-term trends make up a long-term trend. The bull market and bear market usually refer to long-term trends of several months or years.
2. Types of trends: primary trends, secondary trends and short-term trends (Dow Theory).
①Main trend: represents the overall basic trend, which refers to the overall rise or fall of market prices, the longest time span, and the largest price rise or fall. The formation of the main trend often takes a longer time and more funds to be invested. As long as the next rise can exceed the previous high point, and the next fall can be higher than the previous low point, then the overall trend is upward, which is a bull market. On the contrary, the overall trend is downward, which is called a bear market. The trend shown by the large cycle is more reliable, such as the daily line and the weekly line, and the possibility of being manipulated by the banker is extremely small.
② Secondary trend: It is within the main trend and plays an adjusting role in the rise and fall of market prices, also called correction trend.
If the main trend is a bull market, the secondary trend is a downward correction during the upward process. If the main trend is a bear market, the secondary trend is an upward rebound during the downward process. The adjustment range of the secondary trend is generally between one-third and one-half of the main trend.
③ Short-term trend: It is the fluctuation within a day or a smaller cycle, which is a component of the secondary trend. Short-term fluctuation itself is meaningless, so using short-term fluctuation to analyze the big trend is likely to lead to wrong conclusions. Short-term trend lasts for a short time and is easy to be manipulated. It is not recommended for ordinary investors to trade.
----------------------
The big trend is made up of small trends, and small trends are often subject to the big trend. When the trend reverses, the small trend is more sensitive than the big trend. In any market, these three trends must exist at the same time. Any trend will always end, that is, a bull market must be accompanied by a bear market, and the cycle repeats.
Long-term traders are most concerned with major trends: daily, weekly, monthly, etc. Short-term investors are concerned with minor and short-term trends.
What type of trend you choose will depend on what type of investor you are.
3. How to draw trend lines:
Trend lines can more intuitively show the trend direction. They are used to predict future market changes and determine support and pressure. The support or pressure of trend lines will eventually be broken, and the price trend will change.
1. What is a trend line? 2. How to draw a trend line? 3. The function of a trend line and what to pay attention to.
4. Trend end reversal conditions:
1. During the rising process, the callback low is lower than the previous low, and the rising trend line ends. As shown in the figure, point D is lower than point C
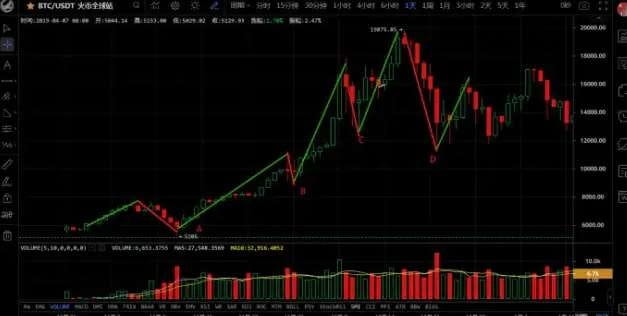
2. In a downward trend, if the rebound high point is higher than the most recent decline starting point, the downward trend ends. As shown in the figure:
5. Determine the trend and trade with it:
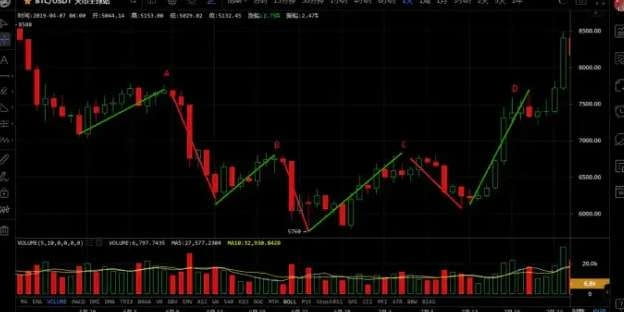
Trend judgment is divided into big trends and small trends. Big trends are bear markets or bull markets, and small trends are short-term price declines or rebounds. If the big trend has reached the bottom and is likely to go sideways, and the short-term trend is a small range of fluctuations, you can choose to buy when the support is high.
For example, the bottom of BTC gradually rises and runs above each moving average. Each moving average gradually moves upward, and multiple indicators show an upward trend.
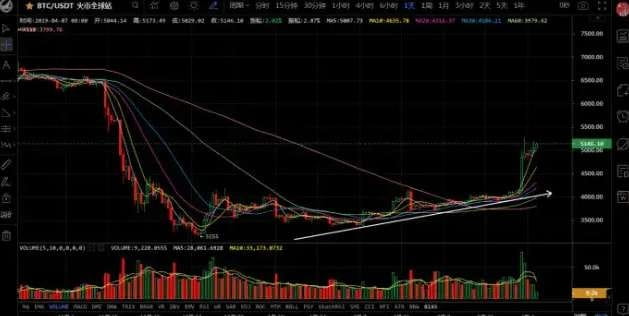
In addition to the above methods of analysis and trend judgment, various technical indicators such as K-line, volume, moving average, etc. should also be used as references;
Other trend indicators include: MA moving average, BOLL indicator, MACD, Fibonacci retracement, etc.
These are historical experiences left over from the long-term evolution of the financial market, and they are successful historical experiences. Behind them are knowledge of mathematics and psychology. Technical analysis is not speculation or predicting the future, but a summary and speculation of changes in the trading market after a long period of statistics, observation, and review by investment masters.
How to draw a trend line for Bitcoin
Drawing a Bitcoin trend line mainly involves the following steps:
1. Determine the trend point
Rising trend line: You need to find two consecutive lower high points and draw an rising trend line through these two points.
Downward trend line: You need to find two consecutive rising low points and draw a downward trend line through these two points.
2. Connect the points and draw lines
Connect the two selected points with a straight line to form a trend line. Make sure the line passes through as many points as possible, but avoid deviating too much from the actual data.
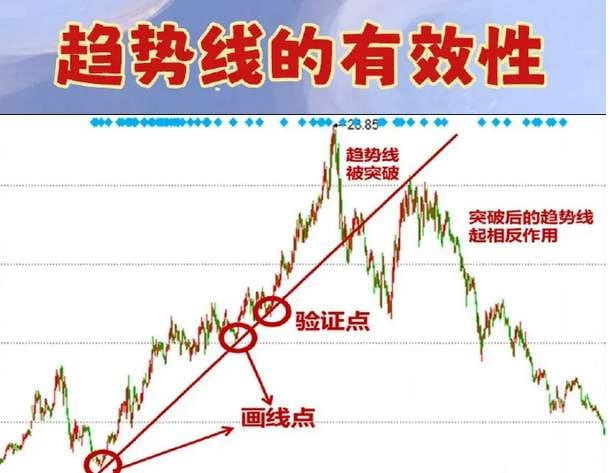
3. Verify the trend line
After drawing the line, observe whether the market behavior conforms to the trend line indication. An effective trend line should play a role of support or pressure in actual operation.
4. Correction and Adjustment
If market activity indicates that a trendline is invalid, the trendline needs to be adjusted. It is usually recommended to use at least three clear points to determine the trendline for greater accuracy.
5. Analyze the significance
Trend lines are mainly used to assist in analyzing market trends and possible turning points. Correct trend lines can help traders determine price trends and develop trading strategies.
By following these steps, valid Bitcoin trend lines can be drawn, which can then be used in technical analysis to predict market movements.
When everyone starts learning trading techniques, they will inevitably come into contact with support and resistance positions.
Support and resistance trading patterns can be roughly divided into two categories:
(1) Trading at a specific position: after the price tests the support and resistance levels, it will rebound or reverse.
(2) Breakout trading: after the price breaks through the support and resistance levels, enter the market to continue the trend.
Therefore, how to accurately judge the support and resistance positions is crucial to trading profitability and is also the most basic skill.
Today I will explain to you what I think are the 8 most common and effective methods for determining support and resistance positions. I believe today’s content will be very helpful to you.
1
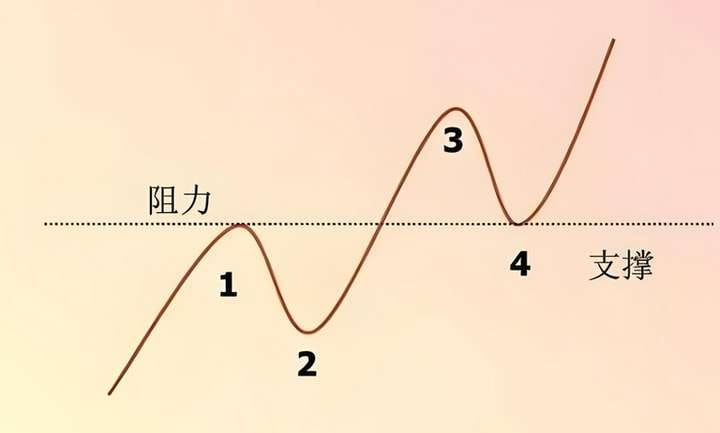
What is the support pressure position?
(1) Support level: refers to the turning point below the current price where the price falls back and encounters support, turning from a decline to an increase.
Look at the picture below. This is a reversal of the support and pressure positions at high and low points.
(2) Pressure level: refers to the turning point above the current price where the rising price encounters pressure and turns from rising to falling.
Please see the picture below. This is the reversal of the trend continuation market pullback pressure and support position.
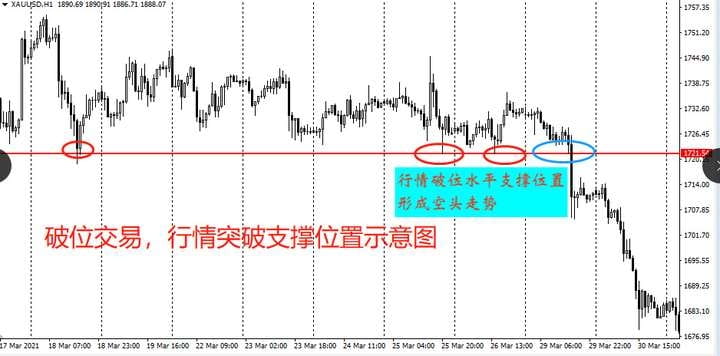
(3) Breakout point: In a breakout transaction, once the market breaks through the support or resistance, the market will continue to move at the breakout point.
Please look at the picture below. This is the market breaking through the support level and the trend continues after the break.
2
8 ways to determine support and pressure
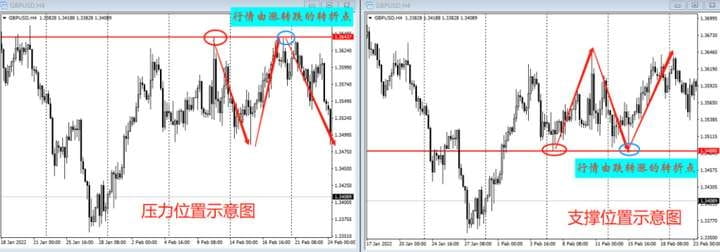
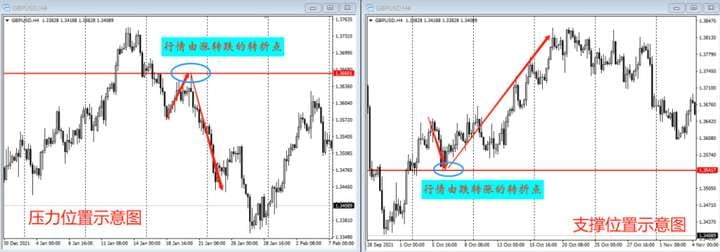
Method 1: Previous highs and lows as support and resistance positions
On the chart, the current highs and lows in price are the most common way to determine support and resistance positions.
Please see the diagram below:
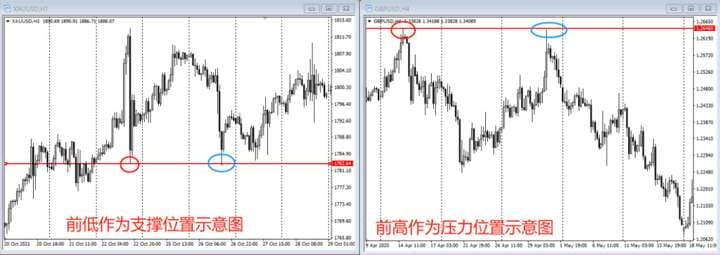
The left side of the picture is the 1-hour candlestick chart of gold. After retracing to the previous low support, the price reversed upward.
On the right is the 4-hour candlestick chart of GBP/USD. After testing the previous high pressure upward, the market reversed downward.
Note:
(1) Select obvious previous highs and lows.
(2) You can use the previous highs and lows of large levels for trading, but not small levels. For example, when trading a 1-hour trend, you can use the previous highs and lows of 4 hours as support and resistance, but do not use the previous highs and lows of 15 minutes or 5 minutes.
(3) Selecting previous highs and lows as support and resistance requires some subjective judgment on the part of the trader. It is best to make judgments when the market is closed or when no positions are held. At this time, traders are relatively calm and objective, and the support and resistance found are more effective. Once determined, do not change them at will.
Method 2: Key prices (support and pressure effects of price integer levels and important historical prices)
(1) The integers of product quotations usually have supporting and pressure effects.
For example, U.S. crude oil is $100 per barrel, or the Shanghai Composite Index is often hit by 3,000 points.
Let’s look at the schematic diagram:
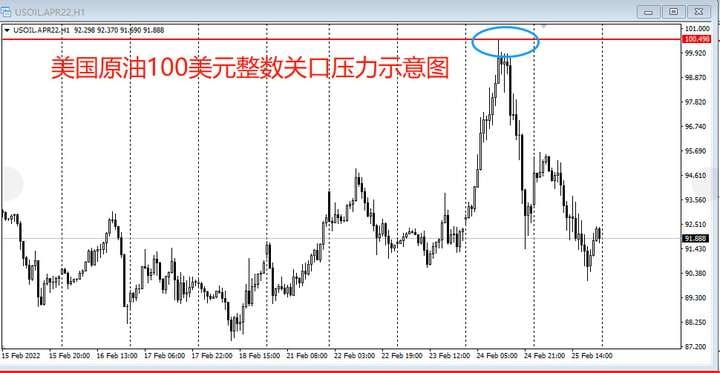
The figure shows the 1-hour candlestick chart of U.S. crude oil last week. The price hit a high of 100.49, breaking through the integer mark of $100, and then reversed downward after consolidation.
(2) Important historical prices.
In the market trend of a certain variety, a relatively special and important price has a supporting and pressure effect.
Please see the diagram below:
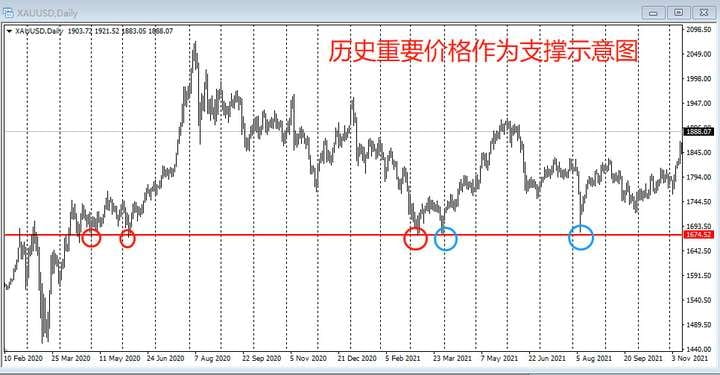
The figure is a schematic diagram of the gold daily line. Affected by the epidemic, the gold price rose to a historical high of 2074, and then fell deeply to a low of 1676. The market was supported at 1676 several times.
Note:
(1) Not all integers have supporting and pressure functions. Only important integers can be used.
(2) There are not many trading opportunities at integer levels and important historical prices, but once they appear, the success rate is relatively high.
Method 3: Use the moving average as a criterion for judging support and resistance
Moving average is the most commonly used technical indicator. It is used as support and pressure position, and it is also one of the most commonly used methods of using moving average.
When the moving average is below the price, the moving average acts as support.
When the moving average is above the price, the moving average acts as pressure.
Please see the diagram below:
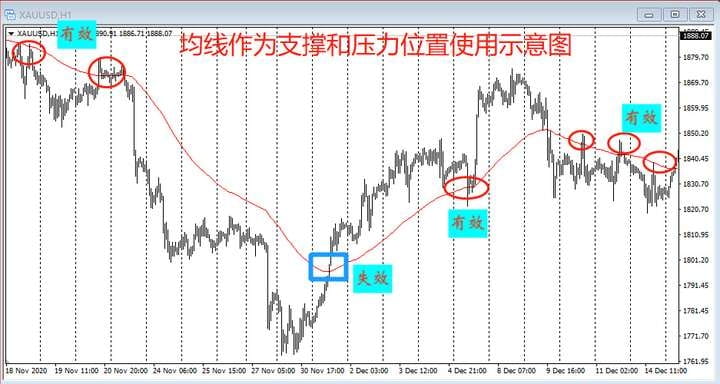
The picture shows the gold 1-hour level K-line, with the moving average EMA90 as a schematic diagram of the support and pressure positions.
Note:
(1) Once you have selected a certain moving average parameter as the standard for support and resistance positions, do not switch it frequently.
(2) The moving average has a great advantage as a standard for judging support and resistance: the moving average is automatically generated on the chart and is clear, obvious and objective, without the need for traders to make subjective judgments.
(3) Do not use a moving average with too small a parameter as support or pressure. A moving average with a small parameter is too close to the market, changes too quickly, and the trading frequency is too high, which is not conducive to execution. At least use a moving average with a parameter of 30 or more.
Method 4: Trend line, channel line
Trend lines and channel lines belong to the same category of indicators for determining trends.
(1) After a trend line is established, it has a supporting or pressure effect before it is broken through in the opposite direction. An upward trend line has a supporting effect, while a downward trend line has a pressure effect.
(2) The upper and lower channels of the channel line have the function of support and pressure. After the market test, there is a possibility of reversal, which can be used as the basis for opening positions and increasing or decreasing positions.
Let’s look at the schematic diagram:
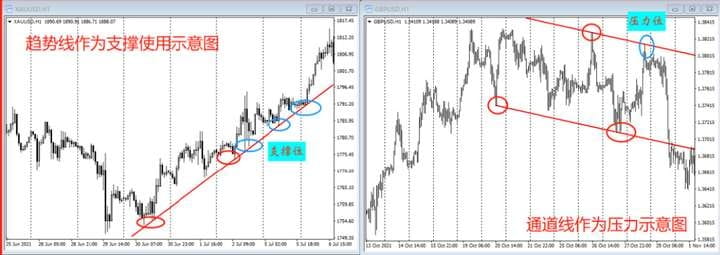
The left side of the picture shows the upward trend of gold at the 1-hour level. After the trend line is formed, the market stabilizes and moves upward after several tests.
On the right side of the picture is the 1-hour K-line of GBP/USD. In the blue circle above, the market reversed under the pressure of the upper edge of the descending channel.
Note:
(1) Drawing trend lines and channel lines on a chart requires traders to make some subjective judgments. In actual practice, try to draw lines when trading is suspended and when no positions are held. After drawing the lines, wait for the market to retrace and try not to make temporary adjustments at will.
(2) Draw lines and trade at this level. Do not use them across levels.
Method 5: Golden Section
There are two ways to use the golden section line as support and pressure.
(1) Golden section withdrawal line.
After the market establishes its direction, it will usually retrace to the support or resistance level before continuing to move. 38.2%, 50%, and 61.8% of the golden ratio are the most commonly used retracement positions.
(2) Golden section extension line.
After the golden section is drawn at the high and low points of a market trend, the golden section indicator will automatically calculate the expansion according to 1.618 times, 2.618 times and 4.236 times, and the 1.618 times, 2.618 times and 4.236 times expansion has a support and pressure effect.
Let’s look at the schematic diagram:
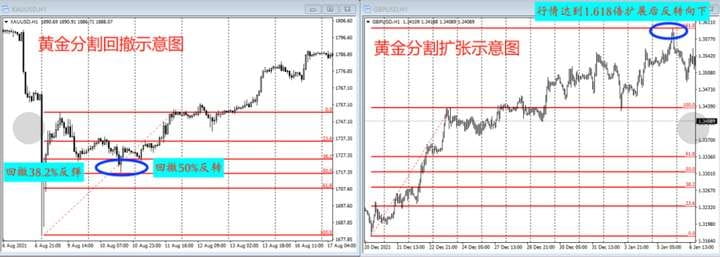
The left side of the picture is a schematic diagram of the golden section retracement. After the rise, the market was established and first retraced to 38.2%. After a brief rebound, the market fell again. After testing to 50%, a reversal K-line was formed, and the market went up all the way.
The right side of the picture is a schematic diagram of the golden section expansion. After a wave of bullishness is established, after a brief horizontal consolidation, the trend continues to rise. When the golden section expansion reaches 1.618 times, the market reverses downward.
Note:
(1) The golden section extension position is often used as a take-profit target position.
(2) To draw the golden section retracement line, draw it from the starting point to the end point of the market. To draw the golden section expansion line, draw it from the end point to the starting point of the market.
Method 6: Gaps
Gaps are usually caused by large price changes when the market is closed or when there is no quotation in the fast market, which causes the price gap between the K-lines. After the gap is formed, the market has a trend pattern of stepping back on the gap.
(1) After an upward gap is formed, it plays a supporting role when the market moves downward.
(2) After a downward gap is formed, it has a pressure effect when the market moves back upward.
Please see the diagram below:
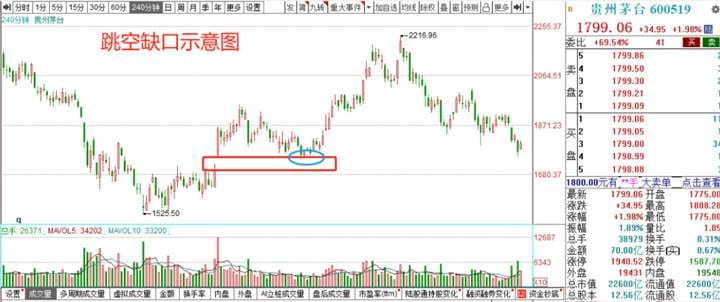
The picture shows the K-line chart of Kweichow Moutai at the 4-hour level. After the market opened higher and rose, it gradually fluctuated and stepped back until it stabilized after stepping on the gap and then rose sharply again.
Note:
(1) For products with intraday trading rules such as futures, stocks, and stock index futures, gaps are more likely to occur.
(2) The gap formed by the break of the top or bottom is more effective.
Method 7: Breaking the upper and lower edges of the pattern and the neckline
(1) Before a consolidation pattern breaks down, the upper and lower edges of the pattern serve as support and pressure.
(2) After the neckline of the consolidation pattern is broken, the trend may continue, which is an opportunity for breakout trading.
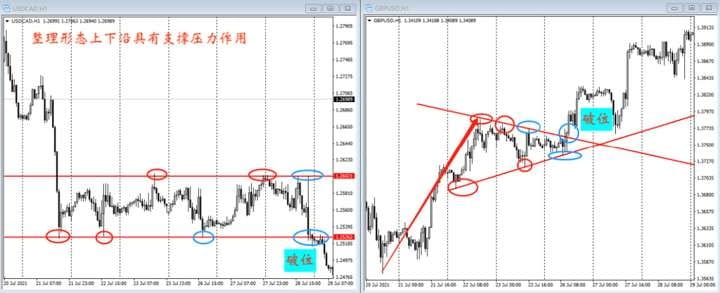
The upper and lower edges of the rectangular consolidation on the left side of the figure formed a reversal trend when the market tested them. The last test below showed a downward break, and you can enter the market to short, and the bearish trend continues.
The right side of the figure belongs to the pattern of triangle consolidation. The market tests the downward trend line and the upward trend line of the triangle, both forming a reversal trend. Finally, the market forms an upward break, you can enter the market to go long, and the bullish trend continues.
Note:
(1) If the spatial range of the consolidation pattern is not large and the profit margin is small, you can only choose to trade in line with the trend. For example, in the right triangle consolidation in the figure, you can only go long at the lower edge of the consolidation pattern and wait for the market to break upward.
(2) The longer the consolidation period, the greater the probability of a breakthrough in the pattern. When trading with the trend, the position should be increased.
Method 8: The concept of support and pressure bands
In actual practice, the market will form consolidation shocks near the support point or pressure point, or even form a false breakthrough of support and pressure, and many orders will be stopped out by the false breakthrough.
Therefore, it is more stable to understand support and resistance as an area and look for opportunities to enter the market within the area.
There are two scenarios for the use of support and pressure belts:
(1) Near the support and resistance levels, select one or two high and low points that are close together as support or resistance zones for trading. Please see the diagram below.
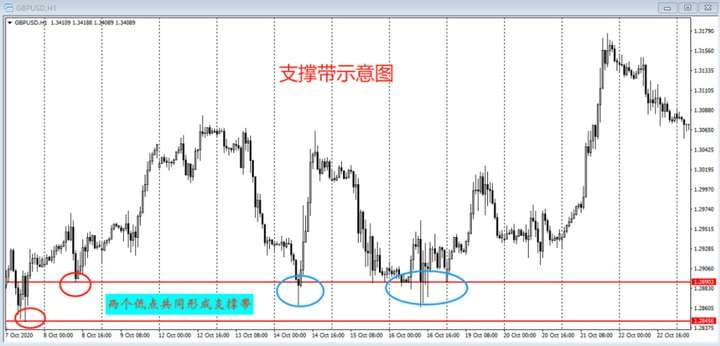
After the market tests the support downward in the figure, select two adjacent previous low points to form a support band. After the market stabilizes in the support band and forms a reversal structure, you can enter the market to trade.
(2) Different indicators for judging support and resistance point to a close price area, and this area can be used as a support or resistance zone for trading. Please see the diagram below.
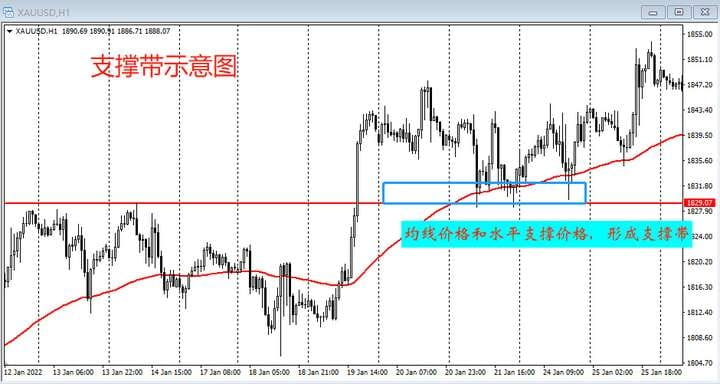
The horizontal support line and moving average in the figure form a support band. The market stabilizes in the support band, and then we enter the market and go long after a reversal structure is formed.
Note:
When trading in the support and resistance areas, it is usually combined with the entry pattern, which makes it easier to set stop losses and manage funds.
3
Considerations for support pressure
1: Use resonance
(1) Different methods of determining the support and resistance positions are used in resonance, such as the resonance between trend line and moving average, the resonance between trend line and horizontal line, etc.
(2) The support and pressure positions are combined with the entry form, or other indicators are used for resonance. For example, a structure entry is formed at the support and pressure position, or the support and pressure MACD, or RSI, such as overbought and oversold indicators, resonate.
Note: 2-3 indicator resonance is the most common and effective resonance trading.
2: The support and pressure that have been tested multiple times are the most effective
And once there is a reverse breakthrough, the space for operation will be larger.
3: The essence of trading is trial and error, and the effectiveness of all support and pressure is probabilistic.
When using support and resistance levels to form a trading system in actual combat, you must strictly stop loss and do a good job of position management.
The above is a collection of 8 methods to determine the support and resistance positions. You can choose 2-3 of them to use. Be sure to review and practice before actual combat.
No matter how diligent a fisherman is, he will not go out to sea to fish in the stormy season, but will guard his fishing boat carefully. This season will always pass, and a sunny day will always come! Pay attention to Yan An, you can fish and fish. The door to the currency circle is always open. Only by following the trend can you have a smooth life. Collect it and keep it in mind!