What does an order block mean? What is an order block indicator? Learn how to identify and trade order blocks in the crypto market through a clear strategy. This guide covers bullish and bearish order blocks, entry methods, risk management, and how to apply these techniques on cryptocurrency exchanges. Below, Kweigo will introduce order blocks in detail!
Trading in the cryptocurrency market requires a strategic approach to navigate its volatility and seize opportunities. Whether you are a beginner or have some experience, understanding and applying effective trading strategies is crucial for success. Common strategies used by traders include trend analysis, scalping, swing trading, and breakout trading, each tailored to different objectives and risk tolerances. These strategies help traders identify patterns, manage risk, and optimize entry and exit timing.
For cryptocurrency traders, a particularly valuable concept is the use of order blocks. Order blocks are areas on price charts where significant buying or selling activity has occurred, often influenced by institutional traders such as banks or hedge funds. They represent high liquidity areas and can be important indicators of future price movements. Unlike random price fluctuations, these areas reveal patterns related to market structure. For cryptocurrency traders, the significance of order blocks lies in their ability to indicate potential reversal or continuation areas for prices, offering opportunities for more confident trading.
What is an Order Block?
Order blocks are specific areas on price charts where a large number of buying or selling orders (typically from institutional traders or market makers) are concentrated. These areas represent important liquidity levels and may indicate key positions for future price movements. Traders view order blocks as tools for predicting potential market reversals or continuations.
Compared to traditional support and resistance levels, order blocks provide deeper insights. Support and resistance areas are usually just generalized zones of price reaction, while order blocks reveal precise areas influenced by significant market behavior. Therefore, they are more reliable in identifying entry and exit points. For example, if a bullish order block forms, it typically indicates that buyers are expected to dominate, pushing prices upward. Conversely, a bearish order block signals that sellers may take control, leading to price declines. These areas help traders predict potential price reaction points based on the actions of large players.
Types of Order Blocks
Bullish Order Block
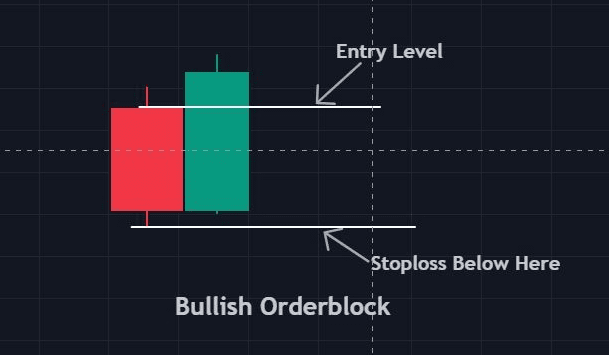
Bullish order blocks are areas on price charts formed by significant large-scale buying transactions (typically by institutional investors). They represent areas of strong buying interest, essentially a high demand zone. This area often serves as a support level—when the price subsequently retraces to this area, it tends to stop falling and rebound upwards. Traders typically view bullish order blocks as potential buying areas, as previous strong buying may push the market upwards again.
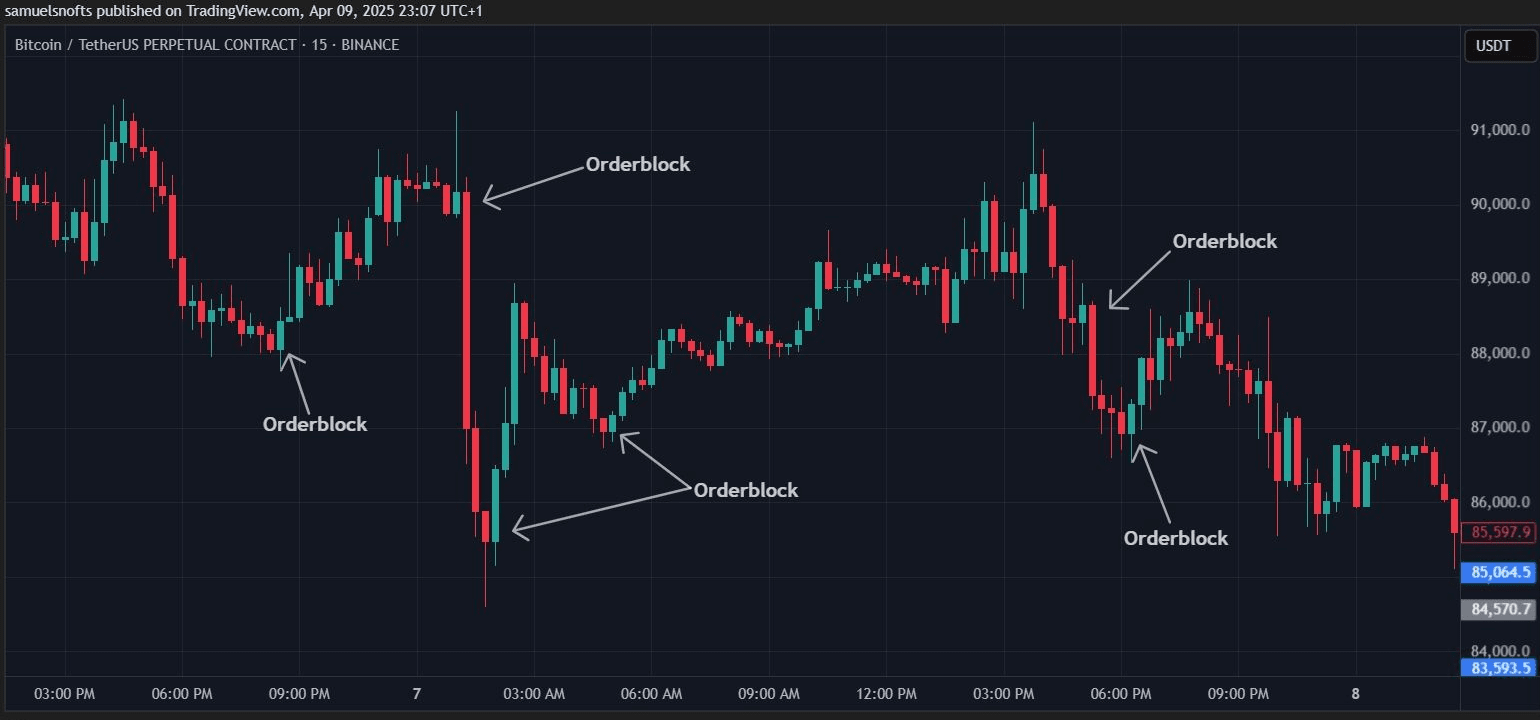
Bullish order blocks typically form at the end of a downtrend, or after a bullish breakout in market structure (i.e., when the trend turns upwards). They are usually marked by a noticeable last bearish (down/red) candle, followed by a strong upward surge. In many cases, the subsequent upward push may even break previous swing highs, confirming that the trend may be reversing upwards. This pattern suggests that large buyers entered the area, absorbed the last selling pressure, and pushed the price up.
Bearish Order Block
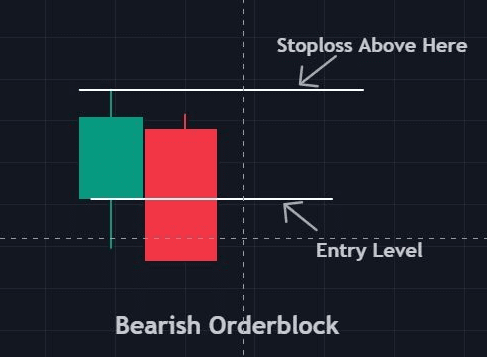
Bearish order blocks, on the other hand, are traces left by large trades where significant selling activity occurs within a price area. They represent areas of strong selling pressure (supply zones) and may suppress further price increases. This area often acts as a resistance level—when the price rebounds to this area, upward movement tends to stall or reverse. In other words, bearish order blocks mark potential selling areas, as previous concentrated selling may push the market down again during a retracement.
Bearish order blocks often form at the end of an uptrend, or after a bearish breakout in market structure (when the trend turns downwards). On the chart, they manifest as a significant drop that occurs immediately after the last bullish (up/green) candle. The subsequent downward trend often breaks previous swing lows, indicating that the trend may have reversed downwards. This pattern suggests that large sellers performed distribution in that area, overwhelming buying pressure and causing prices to fall.
How to identify order blocks
The key to identifying order blocks is to find the price levels where strong reversals occur due to significant buying or selling orders. Order blocks (whether bullish or bearish) can appear on charts of any time frame (ranging from 5 minutes to weekly), but higher time frames such as 4-hour or daily charts often mark more important areas. Traders typically use multi-timeframe analysis—for example, first marking an order block area on the 4-hour chart, and then using the 1-hour chart for entry timing. Below, we will explain step by step how to identify bullish and bearish order blocks.
How to identify bullish order blocks
To identify bullish order blocks, proceed as follows:
1. Determine the market context: Assess whether the price is currently in a downtrend or a consolidation phase. Bullish order blocks typically appear after a price drop or during a pullback—essentially, at the stage where buyers are preparing to enter after a bearish move ends. For instance, in a downtrending market, you should be alert to whether a bullish order block forms as the trend prepares to reverse.
Still the same, the bull market doesn’t know what to do, click on Kweigo's avatar, follow, bull market spot planning, contract password, free sharing.
Stay tuned: $ETH $BTC #币安HODLer空投LA

