The shadow of the candle is the area between the high and low and the body of the candle, while the body of the candle is the distance between the opening and closing. Notice in the image above that the bullish candle has the opening at the bottom and the closing at the top, while in the bearish candle, the opening is at the top and the closing is at the bottom. By default, the chart in the Direction 10 program is represented by candles, and by simply running the chart, you will see the candles as shown in the following image.⬇️
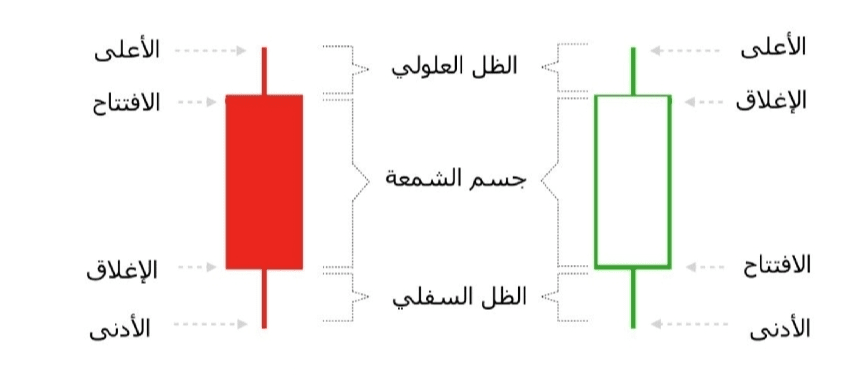
The shadow of the candle is the area between the high and low and the body of the candle, while the body of the candle is the distance between the opening and closing. Notice in the image above that the bullish candle has the opening at the bottom and the closing at the top, while in the bearish candle, the opening is at the top and the closing is at the bottom.
By default, the chart in the Direction 10 program is represented by candles, and by simply running the chart, you will see the candles as shown in the following image.⬇️
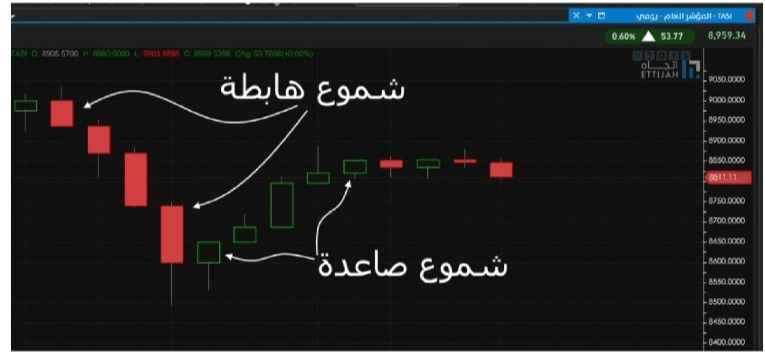
According to technical analysis, the shape of the candle plays an important role in interpreting what happened during the formation of the candle, and by taking the daily chart, we can say that the bullish candle indicates the dominance of bullish trend forces over bearish trend forces and vice versa in the bearish candle.
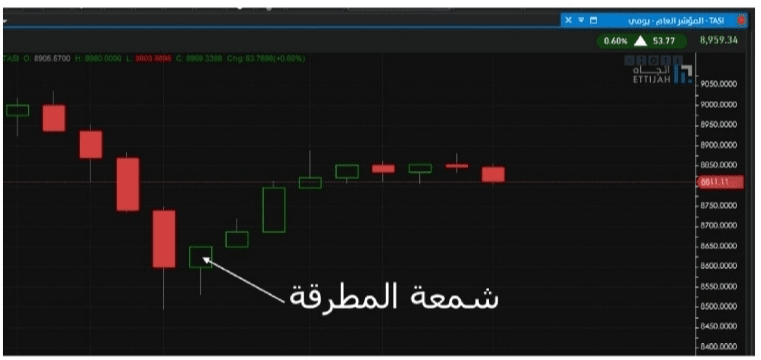
However, the interpretation of Japanese candles extends even further, for example, the previous image indicated a candle called the Hammer candle, which is a bullish candle that indicates that there is a possibility of a price increase, as shown in the following image⬇️.
"There are many types of Japanese candles, and here we will present a study on the most important 19 types of Japanese candles, divided into three types: bullish candles, bearish candles, and neutral candles.
First: Bullish Japanese Candlestick Patterns 🚀📈
• These are candles that are realized and indicate the possibility of a price increase during the upcoming time period. They are considered bullish candlestick patterns that signal to price followers, and then the technical analyst starts to monitor liquidity flows to confirm the quality of the pattern that indicates the possibility of a bullish trend emerging.
1 - Hammer Candle Pattern
The hammer candle is characterized by a relatively long lower shadow, but it has no upper shadow, meaning that the closing price equals or is very close to the high of the candle, so the upper shadow does not appear, while the larger the lower shadow, the better it is to confirm the candle. Also, the opening and closing prices should not be equal, and it is preferable for the closing price to be higher than the opening price, as illustrated in the following image⬇️:
To make the hammer candle a more credible candle, it should come at the end of a bearish price movement, that is, after a price drop, because a hammer candle may not be effective if it appears after long bullish waves; rather, it may turn into a negative candle.
2 - Inverted Hammer Candle Pattern
The inverted hammer candle is a candle with a non-visible lower shadow, while its upper shadow is relatively large, and it is preferable that the closing price is greater than the opening price, as illustrated in the following image⬇️:
In the inverted hammer candle, it is preferable for it to appear after a price drop for a period of time because if this candle comes after a noticeable bullish price movement, it may not succeed; rather, it may become a bearish candle.
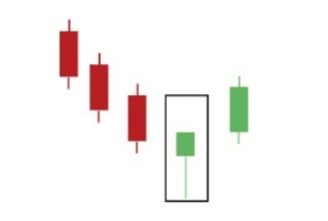
3- Bullish Engulfing Pattern
This pattern consists of two consecutive candles, the first one in which the price dropped, but then a candle came that opened below the closing price of the candle that dropped, but it rose again and closed at levels higher than the opening of the candle that dropped. It is preferable that the shadows of both candles are small as much as possible to increase the credibility of the candles, as illustrated in the following image ⬇️:
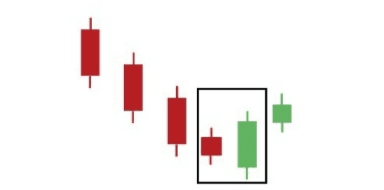
When a bullish engulfing candle appears after a bearish trend, it shows the possibility of a reversal in price movement and the price tends to rise in the upcoming time period.
4- Bullish Kicker Pattern
A composition of positive candles, characterized by being one of the wonderful candles that occur at support levels where the price drops in the first candle, but then a bullish candle opens with a price gap, and the opening of the second candle is higher than the opening of the first candle that dropped, and the new bullish candle closes at levels higher than its opening. It is also preferable that it closes above several previous candles, as illustrated in the image ⬇️
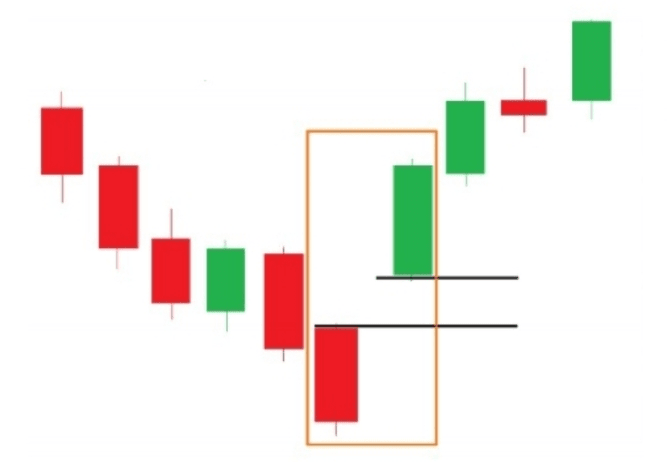
The longer the bullish candle, the better the indication of buying power, and the best place for it to form is when a support is broken in the bearish candle, then the price opens above the support again, and the price rises. The following image illustrates the composition of the candle and how to observe it in financial markets.
5- Bullish Piercing Line Pattern
This candle resembles the bullish engulfing candle, but the closing of the bullish candle is within the body of the bearish candle. The price drops in the first candle, then the price opens below the closing price of the bearish candle, and it is also preferable to open below the lowest price of the bearish candle. After that, the price rises, and the second candle closes higher than the closing level of the bearish candle, and it is preferable that the closing is above 50% of the body of the bearish candle. The following image illustrates the candle⬇️:
This candle is good to indicate the likelihood of a price increase returning, and it is preferable that it comes after a bearish trend. However, it is also possible to observe this candle during bullish trends, indicating the likelihood of continuity in the bullish trend and the failure of a bearish correction.
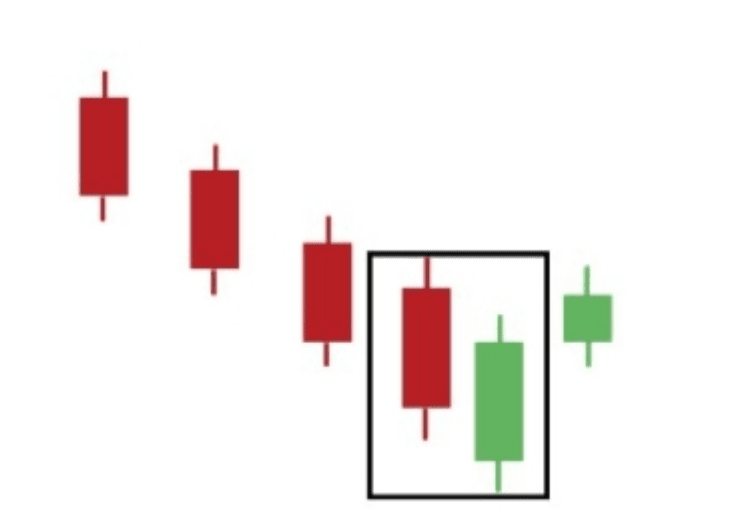
6 - Bullish Harami Pattern
This is a bullish candlestick pattern; the first candle is a long bearish candle, then a new small bullish candle comes. The condition is that the small bullish candle is within the trading range of the body of the bearish candle, meaning the high and low of the small bullish candle are within the body of the long bearish candle. The image illustrates the bullish candle pattern⬇️.
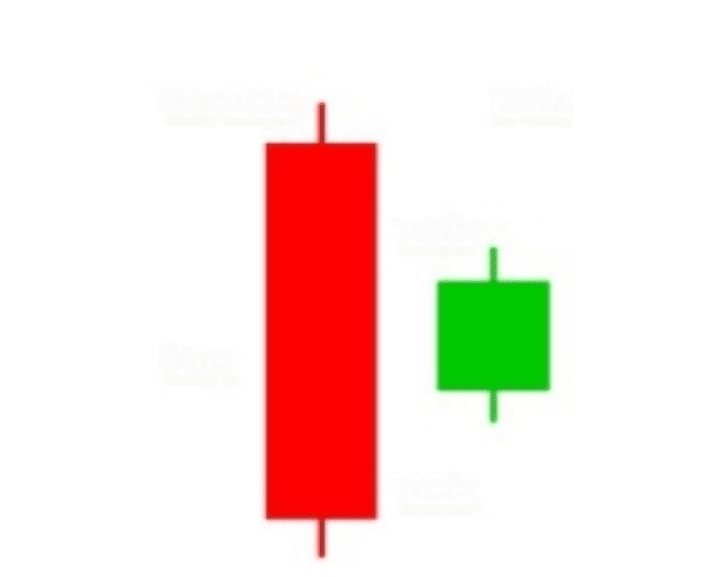
• It is important to note that this candle may need some confirmation through a new bullish candle that closes above the opening of the first bearish candle, but in general, it is one of the good candles that confirms the possibility of a price reversal, and it can occur during bullish trends or after the end of a bearish trend.
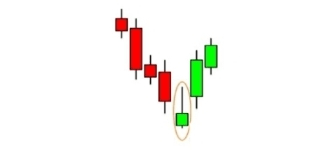
7 - Morning Star Pattern
• It is one of the very important candles in technical analysis, and it comes after a period of declining prices. This candle is considered a combination of three inside candles: the first candle is a bearish candle, and the longer it is, the better it is, then a small bullish candle comes, but this candle opens and closes below the closing of the first bearish candle, and finally, another bullish candle is formed, but it is long and closes at levels close to the opening of the first bearish candle. It should be noted that closing the third candle above the opening of the first candle makes this pattern stronger. The following image illustrates the candle⬇️.
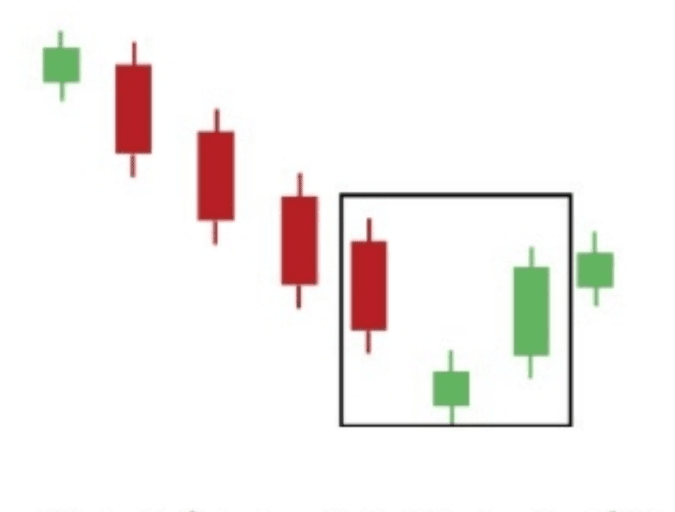
It should be noted that this candle comes at the end of a bearish trend, or the end of a bearish correction, and it cannot be relied upon if it occurs within a continuous bullish trend. In general, this candle is considered one of the strong candles, especially if it comes at a broken support level but the price returned in the last third candle to trade above the support.
8 - Doji Morning Star Pattern
This candle resembles a regular morning star candle, but the middle candle is a doji candle, meaning that the opening and closing prices are equal, and the distance between the high and low is relatively small. The price decreases in the first candle, and a support line may be broken, but in the second candle, a doji is formed, meaning that the candle is very small and the opening price equals the closing price. After that, a candle appears where the price rises and closes above the support lines, and the following image illustrates the composition of the candlestick pattern.⬇️
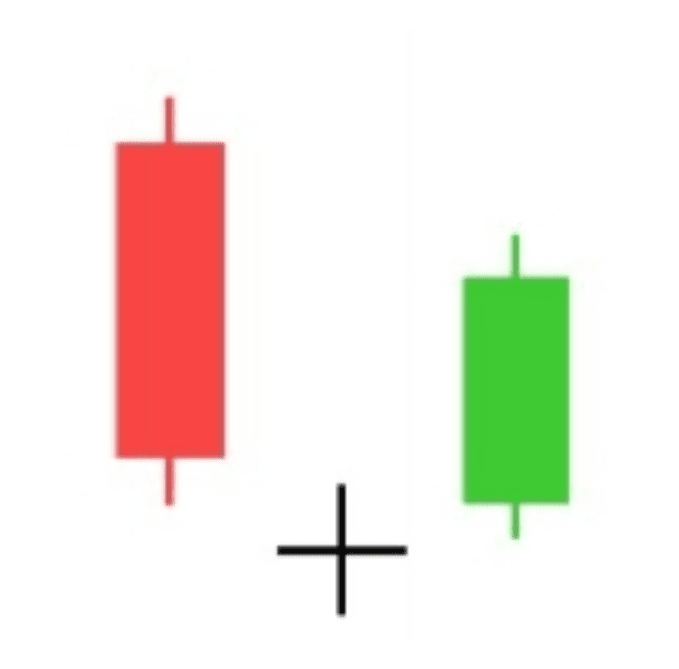
The same conditions that apply to the morning star candle apply to this pattern, but at the same time, some experiments have indicated that the doji represents a confusion among traders, so the follower of this pattern may need to wait a little until confirming the return of trading above the opening of the first bearish candle.
9 - Dragon Doji Candle Pattern
This is a naturally positive candle, and it is a single candle where the opening price equals the closing price. However, it has a very long lower shadow compared to the upper shadow, and the upper shadow may not exist at all, meaning that the high equals the opening and closing or is very close to them. This candle is considered a bullish candle: it can be relied upon during an upward trend when the price starts to fluctuate within a limited range, as the appearance of this candle indicates that the bullish trend forces are still present. However, in bearish trends, one should wait a little until confirming the appearance of subsequent bullish candles because the dragon candle in bearish trends may be less powerful, unless it is part of a morning candle structure of the doji type, meaning it is the middle candle, which increases the credibility of the doji type morning star candle. The following image illustrates the dragon candle:⬇️
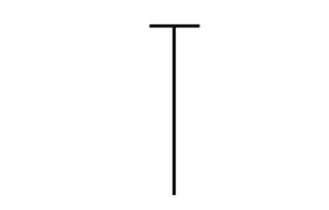
It should be noted that the candle should not be relied upon if the lower shadow is not long enough, as the longer the lower shadow, the stronger its signal, and the candle becomes more credible. One must be very cautious with this candle because if it appears after a strong upward trend and near resistance, it may be a very negative signal contrary to its type, as the candle appearing after a strong upward trend and resistance indicates that it is a bearish reversal candle and sometimes, because it resembles the hanging man candle.
Although there are many other positive candles, these 9 main candles are the most commonly used among technical analysts, as their success rates are good if their conditions are fully met.
........................
🔴 Today, God willing, I will explain the bearish Japanese candlestick patterns.
........................
🔔📝 Don't forget to like 👍 and follow us for encouragement to receive all new updates, thank you to those who said done, thank you all 😍
....................