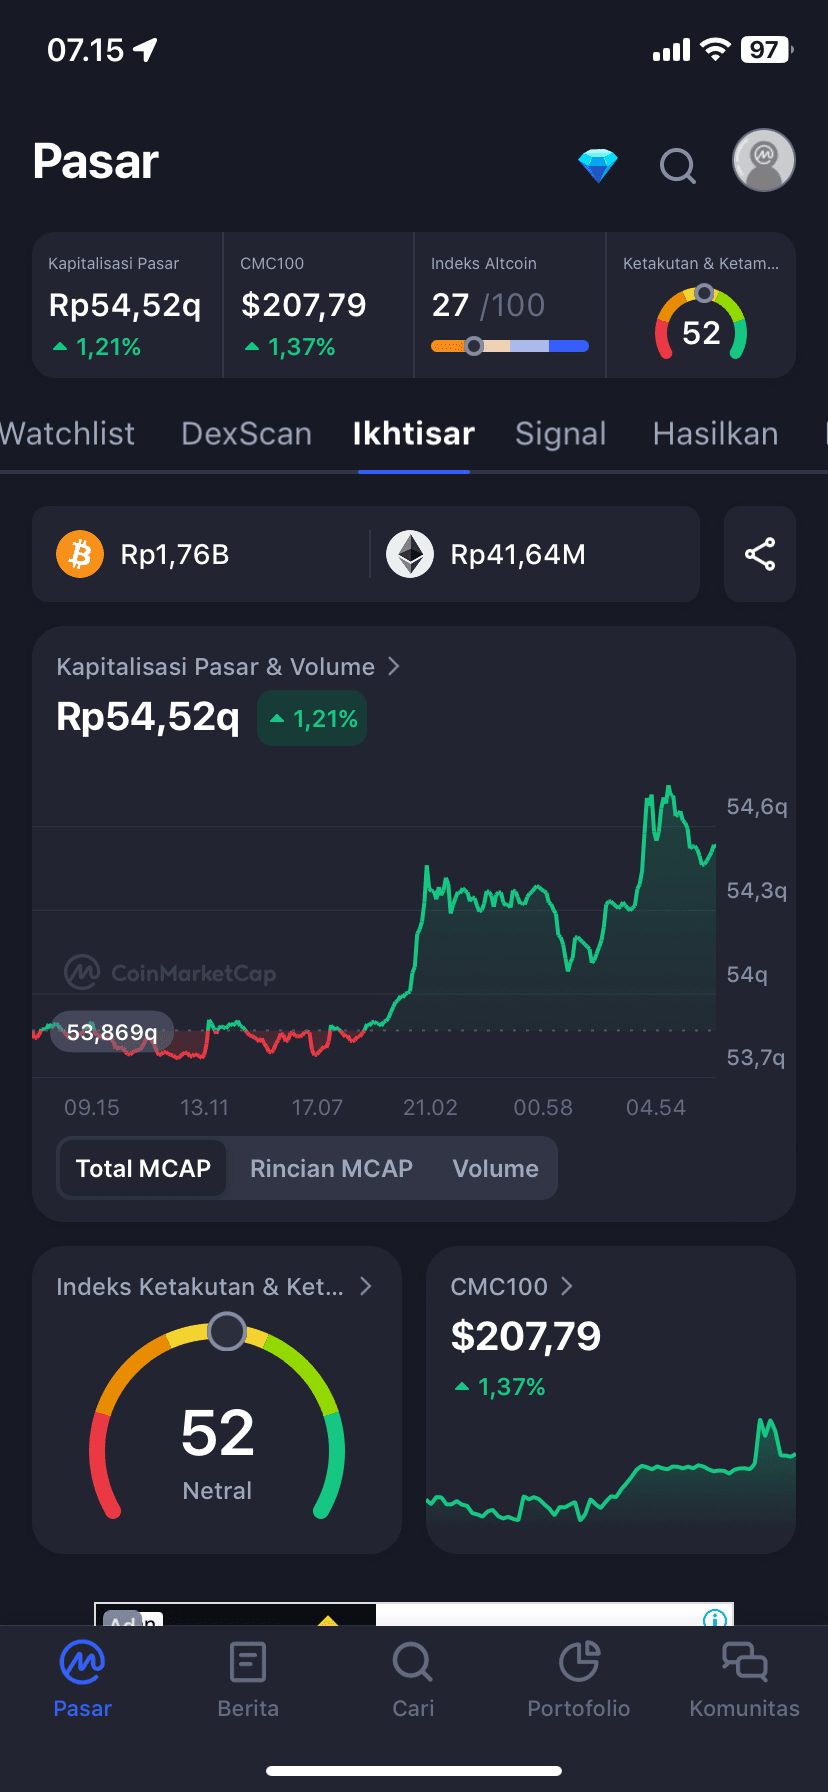
The crypto market shows signs of slight recovery. Market capitalization increased by +1.21% with the fear & greed index at level 52 (Neutral), indicating the market is in a waiting phase.
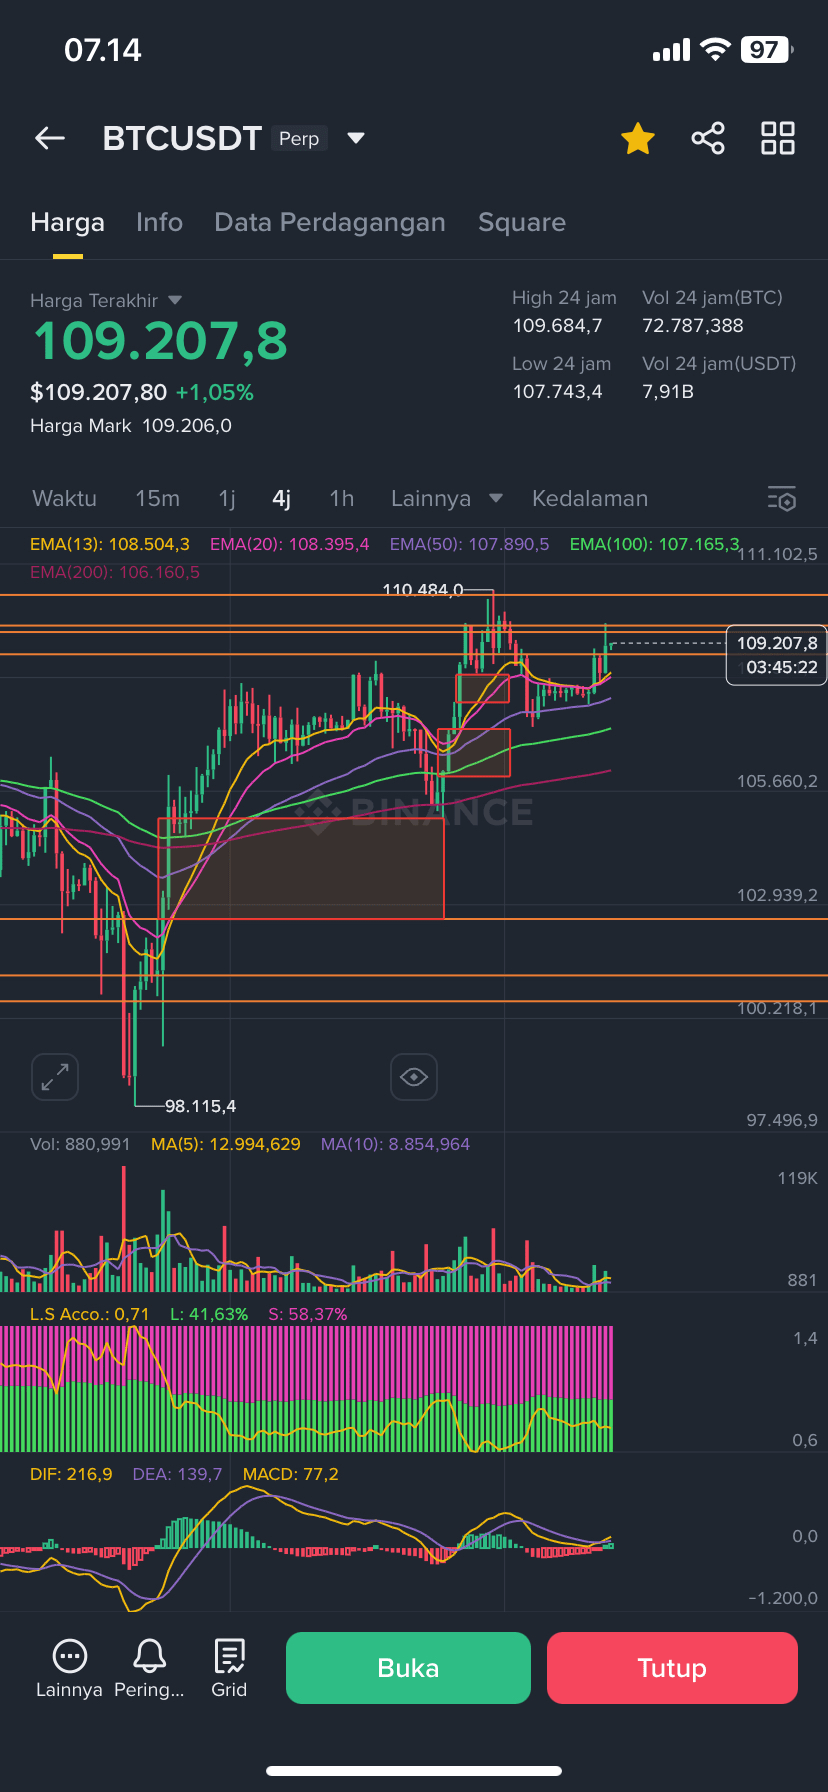
BTC/USDT (4H) – Technical Signal:
BTC stays above EMA13/20/50/100 and approaches minor resistance at $109,684.
The higher low structure is still maintained, while volume starts to increase, indicating gradual buying interest.
MACD shows a slight golden cross, bullish short-term momentum signals are beginning to form.
Long vs Short Ratio: 41.63% Long vs 58.37% Short – the majority is still biased short, opening the potential for a short squeeze.
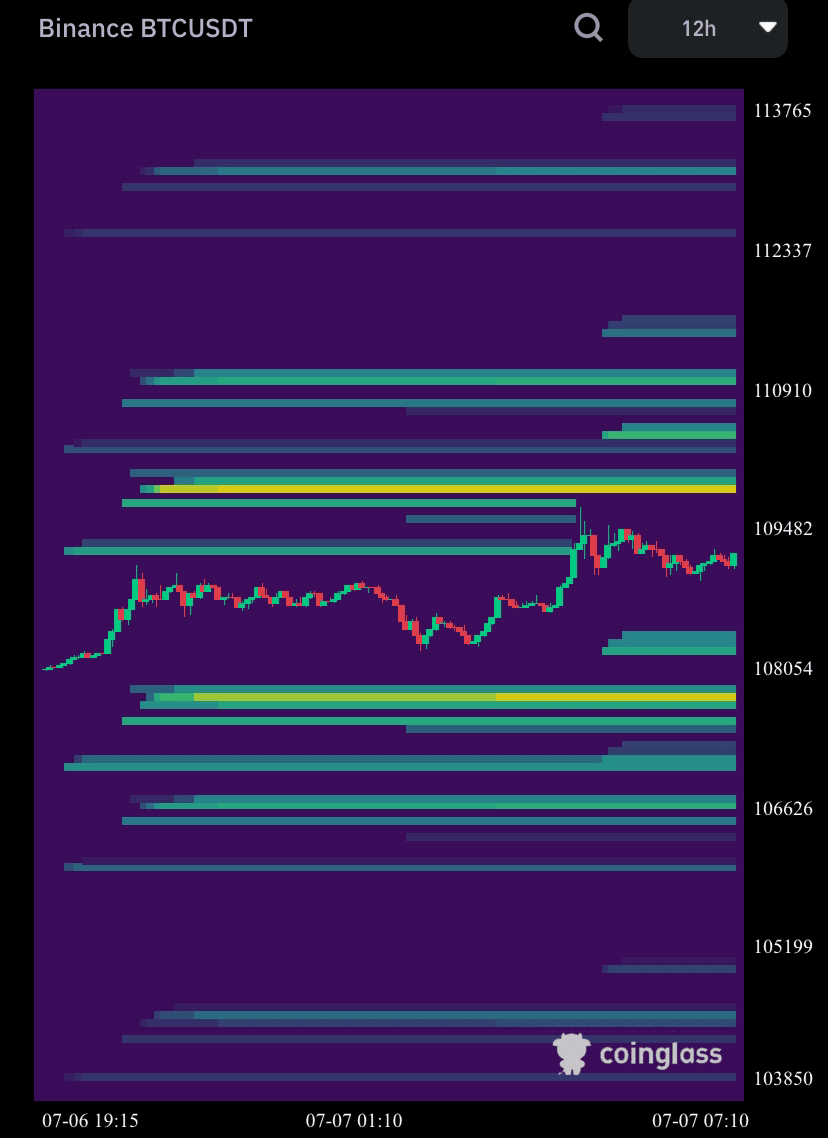
Coinglass Heatmap (Liquidity Map):
Strong liquidity is seen in the $110,910 - $112,000 zone, becoming a potential target for stop short hunting.
Strong support holds in the range of $106,600 - $108,000.
Potential Fundamental Catalysts:
US CPI release this week – potential for major volatility mover, especially if inflation data surprises the market.
Uncertainty in the global stock market & weakening DXY could support BTC technically.
🎯 Trading Strategy:
✅ Long Plan
Entry: $108,500 - $109,000
Target: $110,900 - $112,000
SL: Below $107,700
Confirmation: Golden cross MACD + staying above EMA50 (4H)
❌ Short Plan (only if strong rejection occurs)
Entry: $110,900 - $111,500
Target: $108,800
SL: Above $112,300
BTC is currently building short-term upward momentum with significant liquidity above the price. Focus remains on macro data this week (especially CPI). Watch for break or rejection at the $110,900 level as a determinant for the next direction.
#Bitcoin #CryptoOutlook #BTCAnalysis #BinanceSquare #TechnicalAnalysis #BTCUSDT #CryptoStrategy