The following views do not represent the views of any organization or individual and do not constitute any investment advice. Please do not make investment decisions based on this information.
1. Holding cycle storm chart
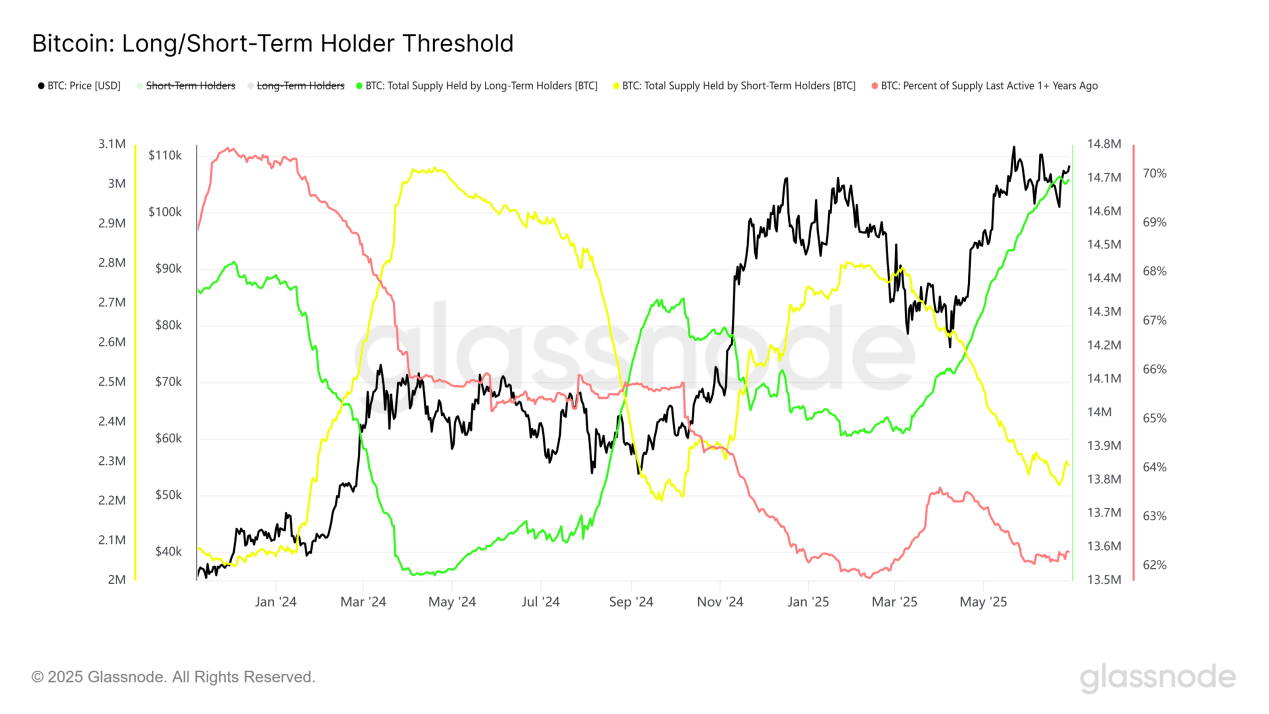
This week, long-term holders sold about 10,000 BTC, and now hold about 1.469 million BTC. The increase in holdings has slowed down, but no large-scale distribution has been observed. The trend is still unclear, but the window for the next concentrated distribution by long-term holders is not far away. The supply of long-term holders for more than one year (red line) shows that the small-scale distribution trend has just ended, and the cumulative trend has not formed a scale. The market seems to have entered a critical decision period. (Figure 1)
2.BTC Global Momentum Radar Chart
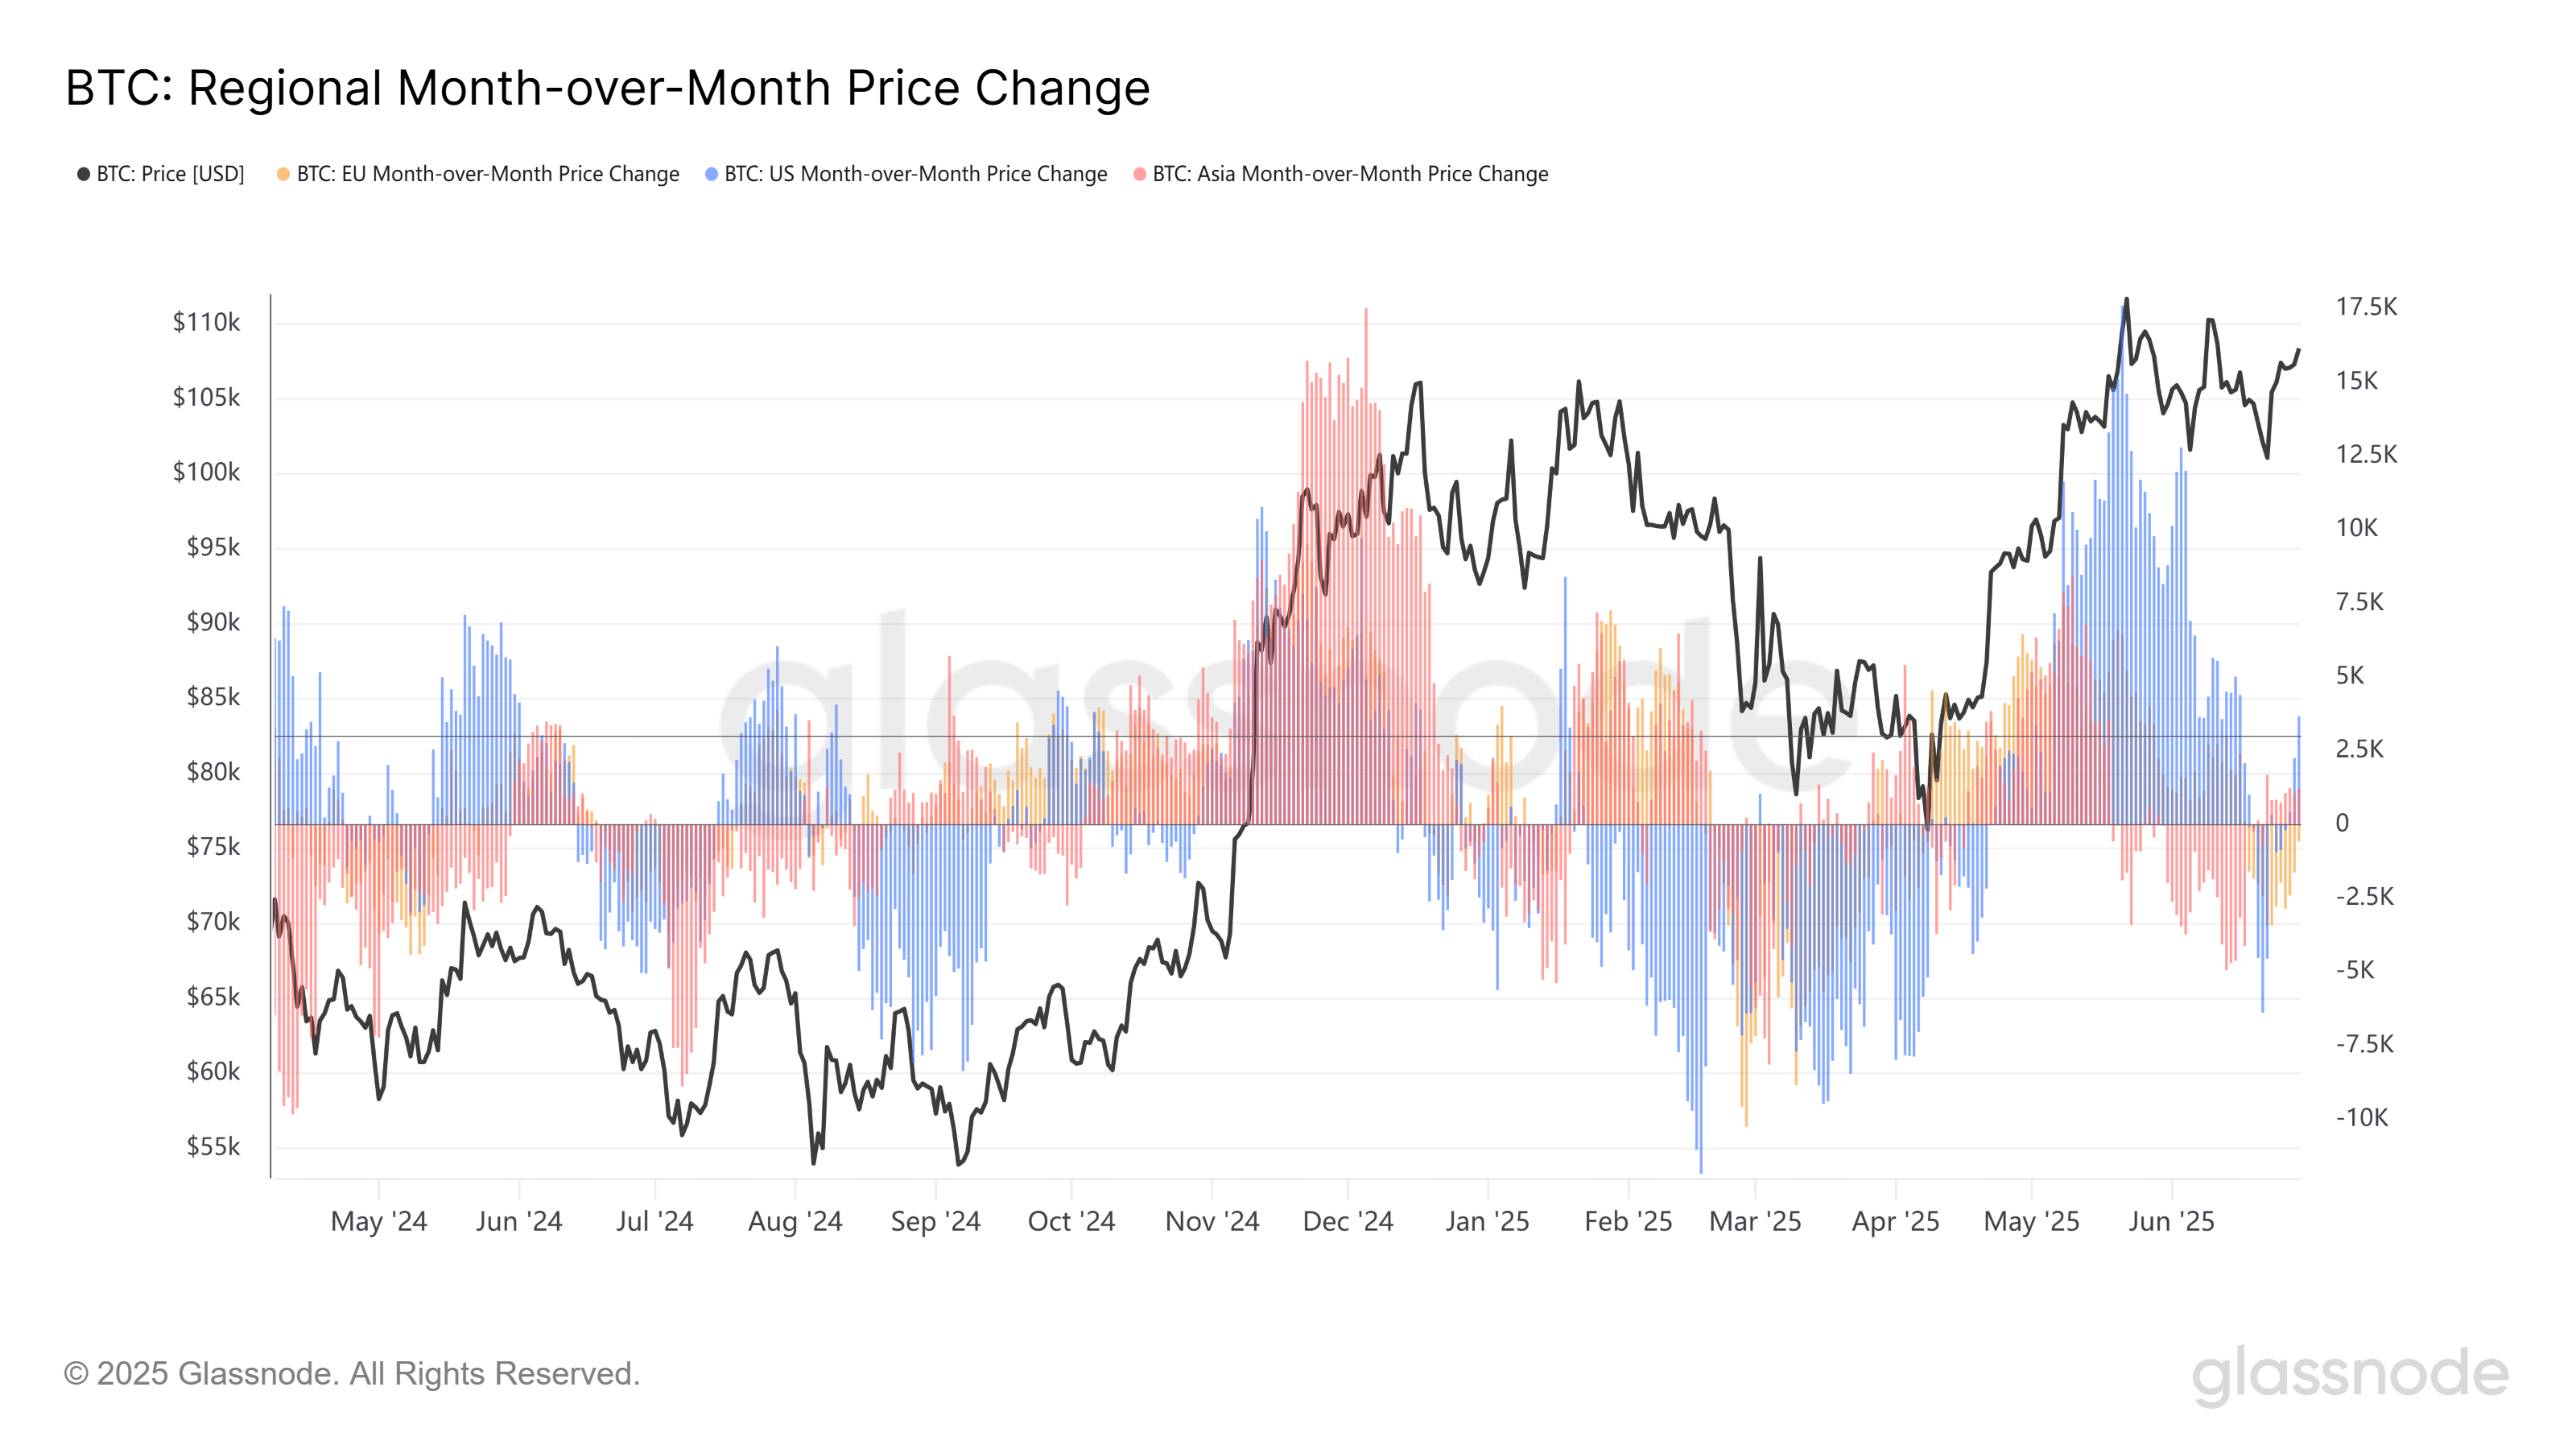
The market generally regards investor sentiment in the Americas as a leading indicator - when sentiment in the Americas improves, BTC prices tend to strengthen afterwards; while investor sentiment in Asia is often regarded as a reverse indicator: if sentiment in Asia rises and sentiment in the Americas falls, BTC is very likely to peak in the short term. In contrast, the European market represents more of the medium- and long-term flow of large amounts of funds.
According to this week's data, sentiment indicators in all time zones around the world have rebounded, with the most significant rebound in the Americas. By comparing the time nodes, it can be found that the time node of the rapid rebound was exactly when Bowman and others hinted at the expectation of interest rate cuts on Twitter, which quickly broke the downward trend of global sentiment and ignited investors' enthusiasm on a small scale. (Figure 2)
3. On-chain killing curve
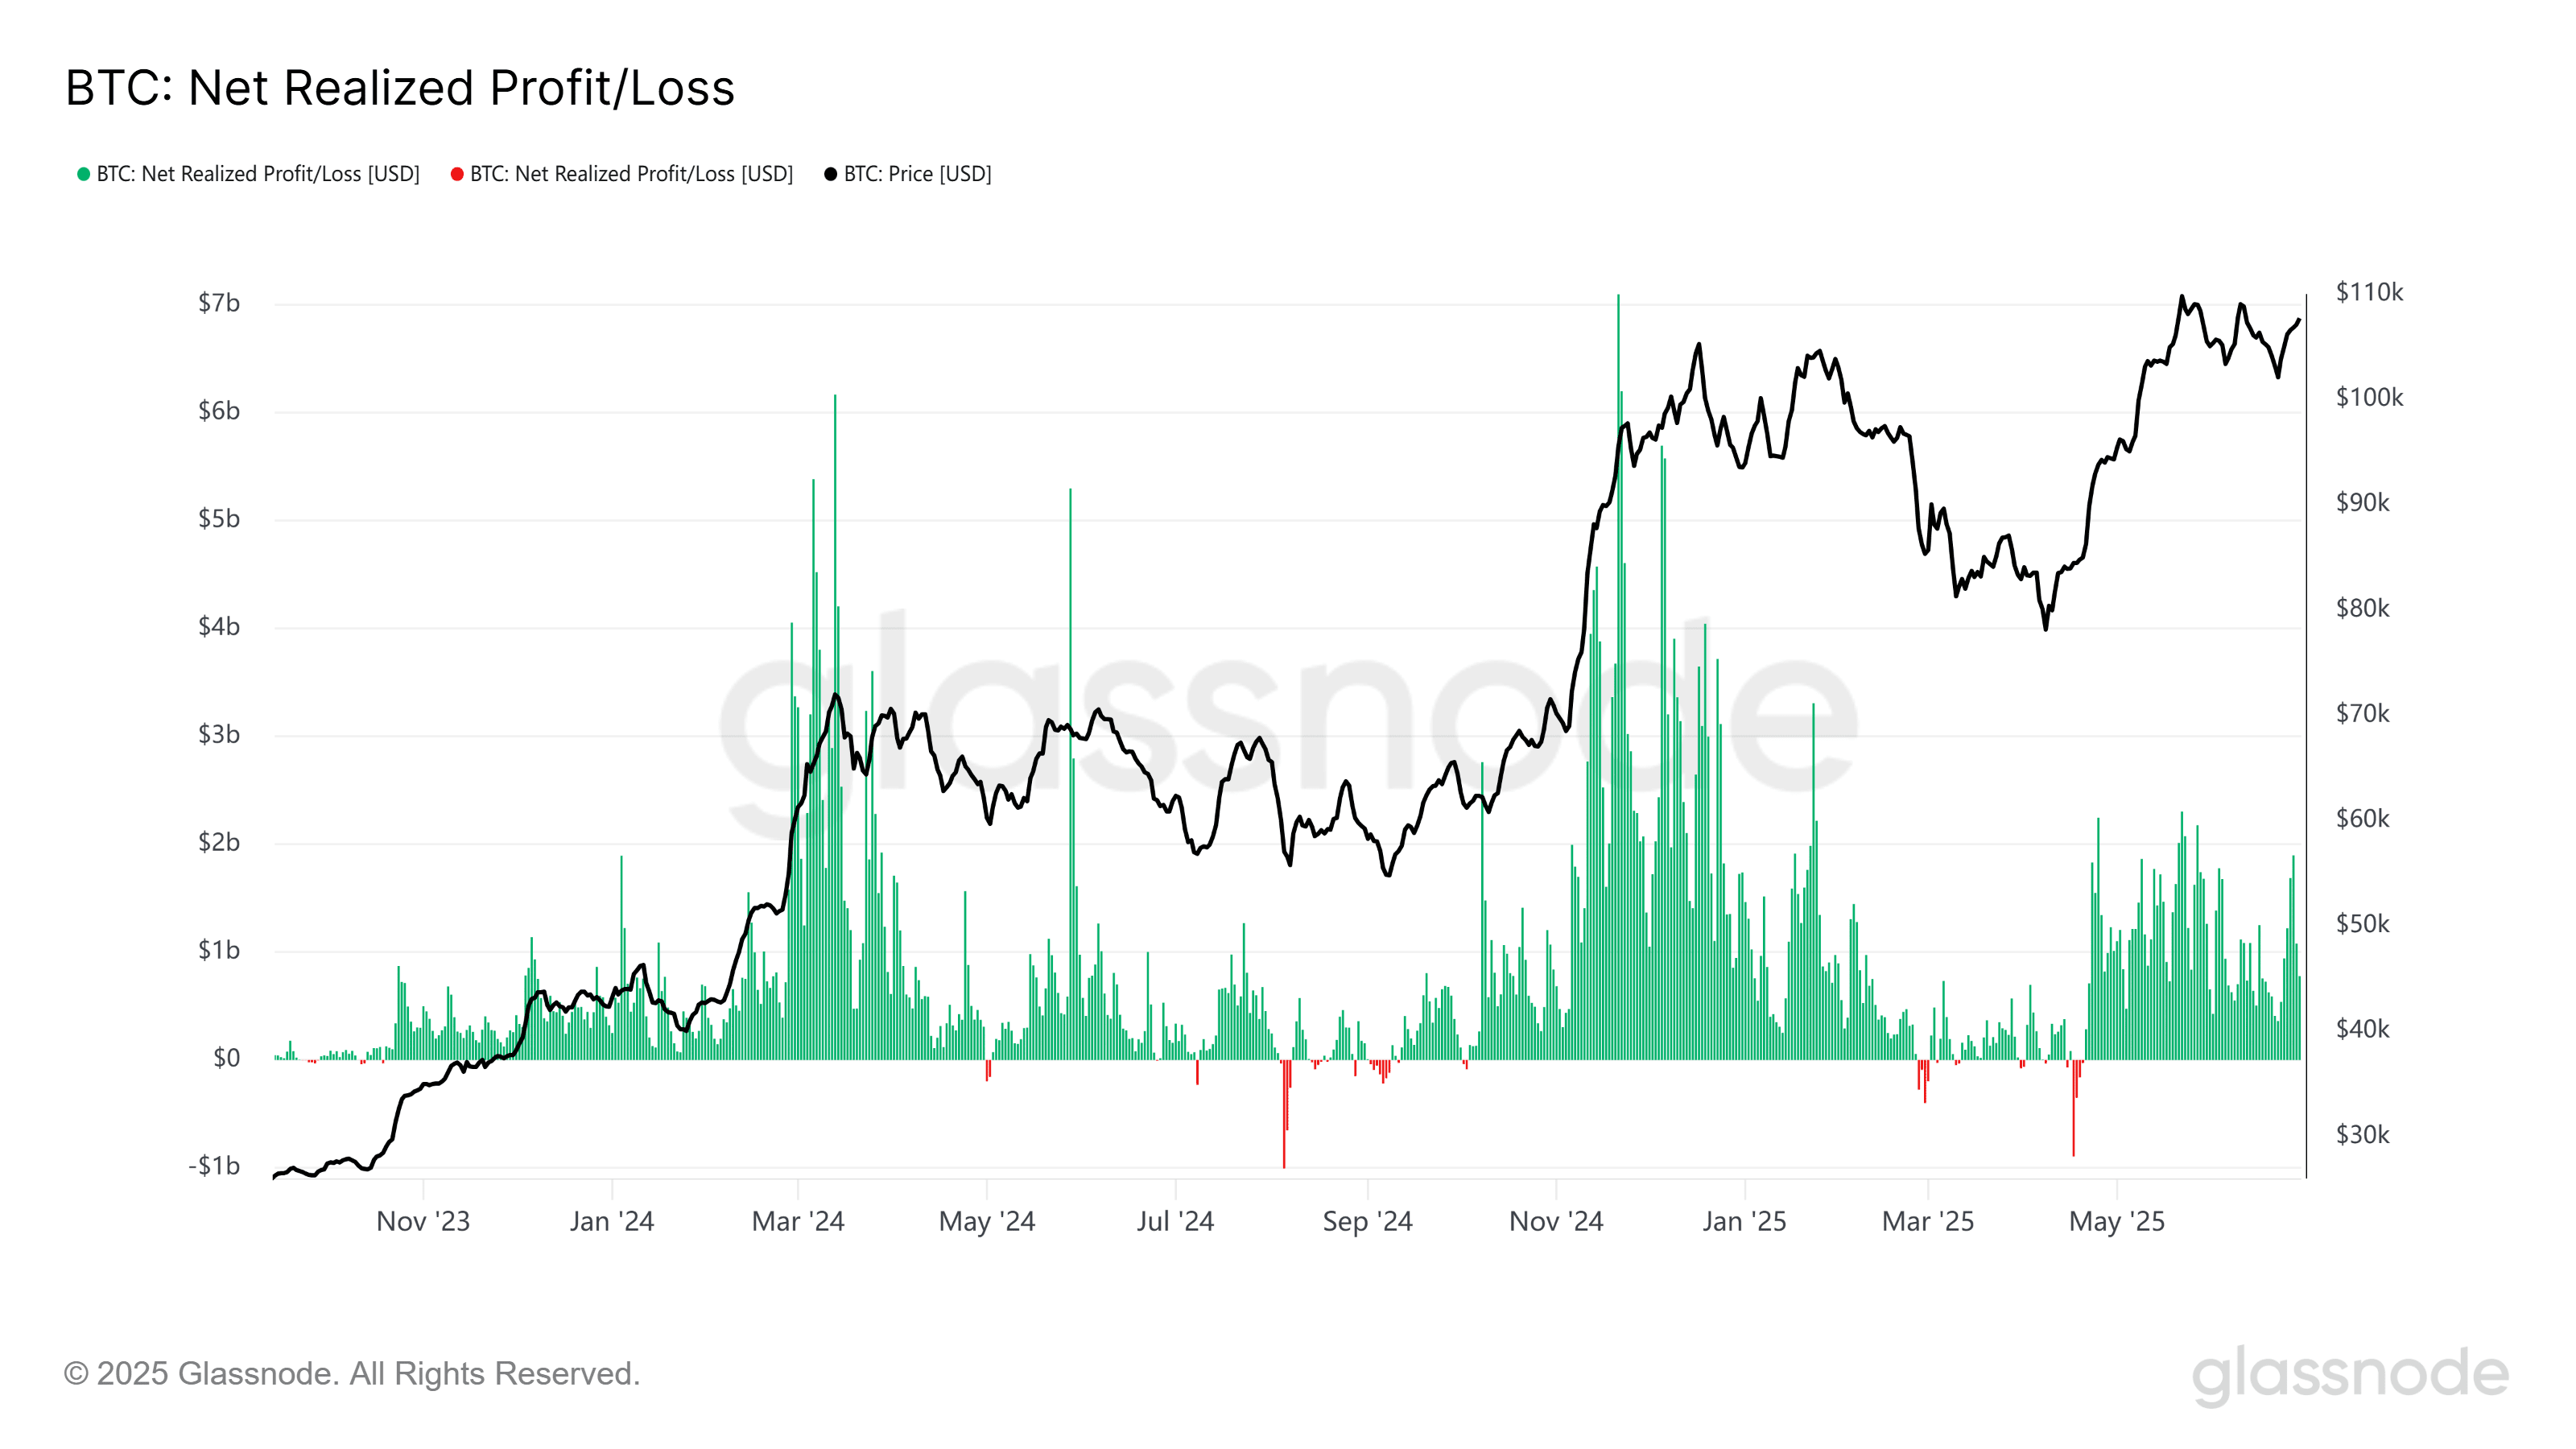
The downward trend of profit realization has been broken! The month-long shrinking trend was broken with the expectation of interest rate cuts ahead of schedule. This week's profit-taking phenomenon was significantly greater than last week. Investors' enthusiasm may grow with the growth of profit phenomena, but it is too early to assert that the trend is reversed. We need to observe whether the rebound trend can continue. The data has a certain lag, and a longer period is needed to verify the trend. (Figure 3)
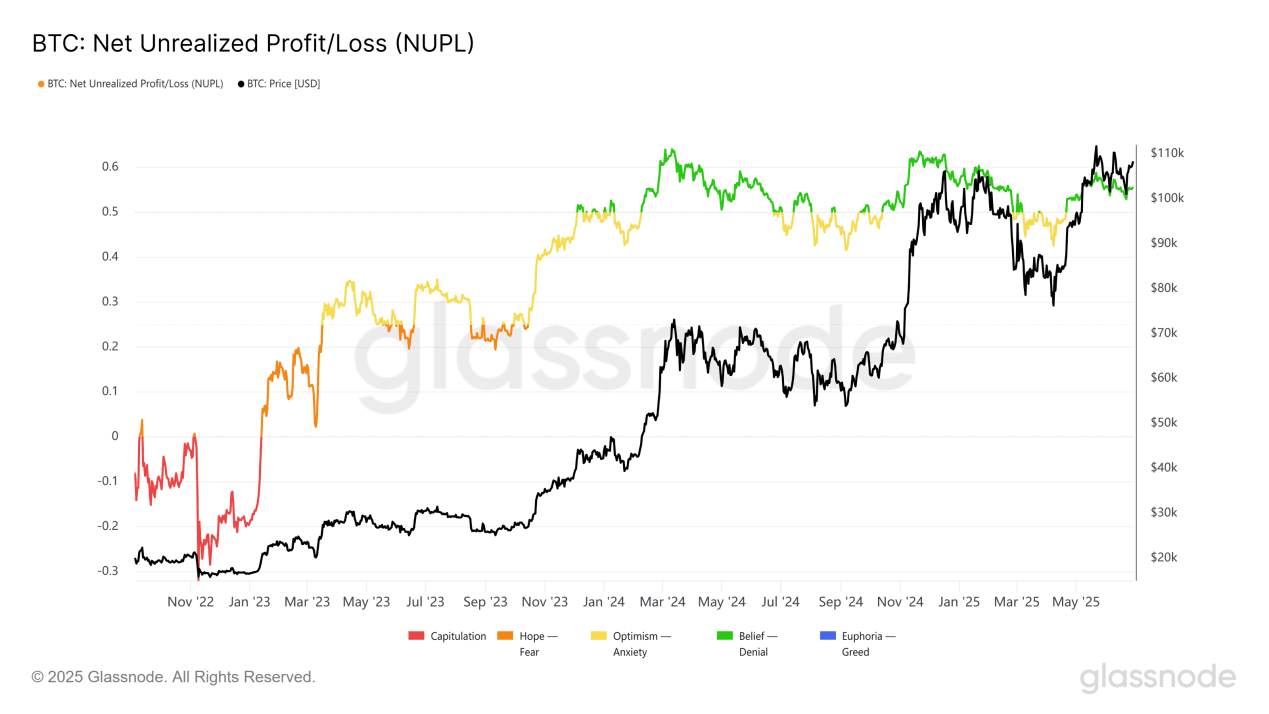
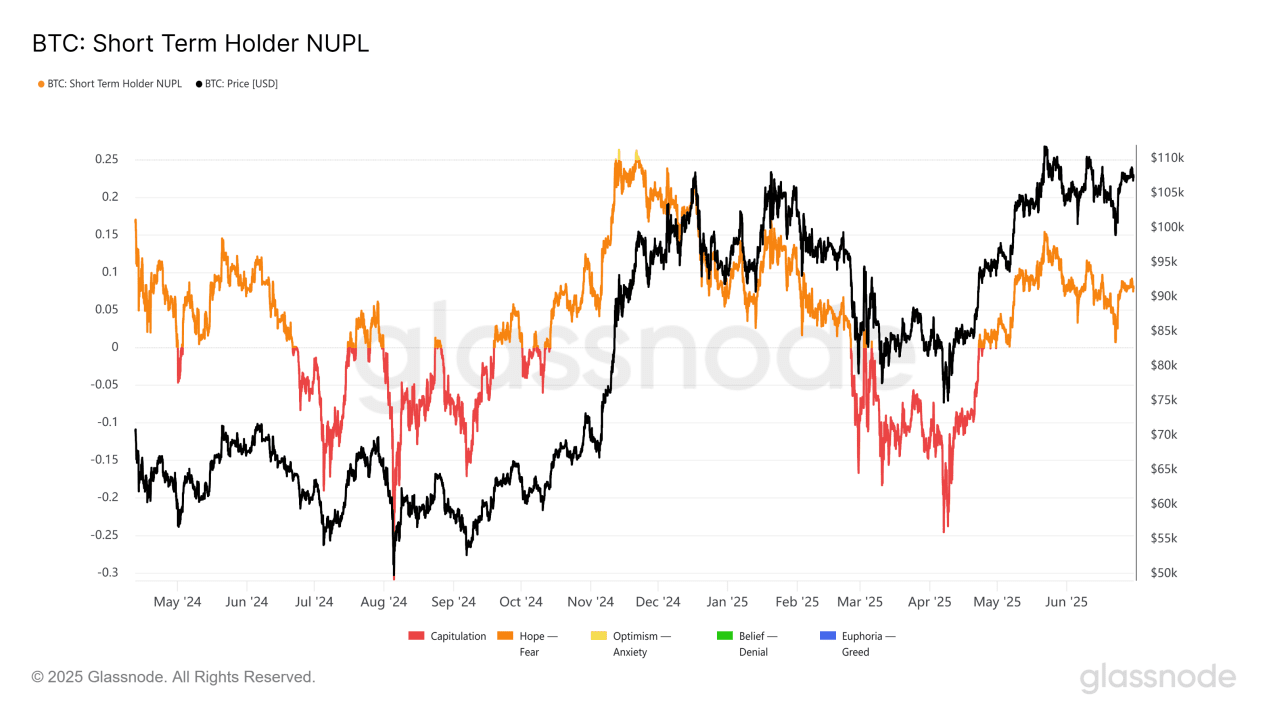
4. Chain Illusion Research Instrument
At present, the average profit rate of all chips in the market remains at around 52% (Figure 4). However, the profitability of short-term holders has not broken through the downward channel and has not effectively broken the downward trend. This seems to contradict the on-chain killing curve, but it also proves that the market has entered a critical decision-making period. The long and short forces are fighting, the old trend is being verified, and no new trend has been clearly established (Figure 5).
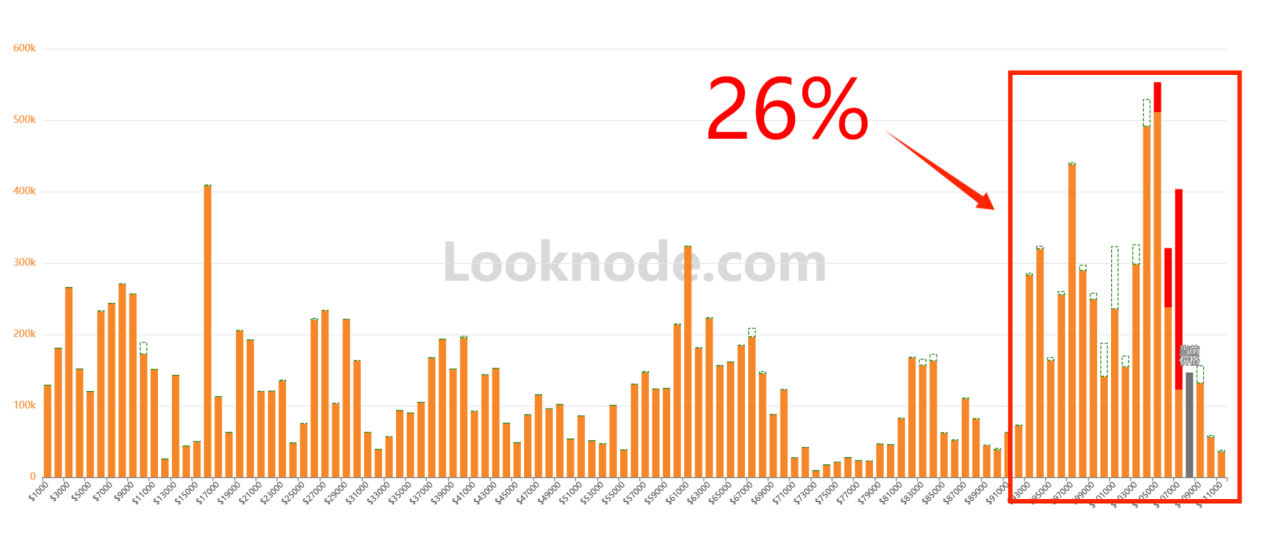
5.UTXO Energy Band
After the support level of $98,000 was verified, coupled with the speculation of interest rate cut expectations, BTC ushered in a rapid V-reversal market. It is worth noting that the current high chip concentration has reached a historical high of 26%. In the past, whenever the chip concentration reached this level, BTC would most likely usher in a big market. We seem to be standing at a node where we have to move in a certain direction, and we urgently need a new price range for chip turnover (Figure 6).