
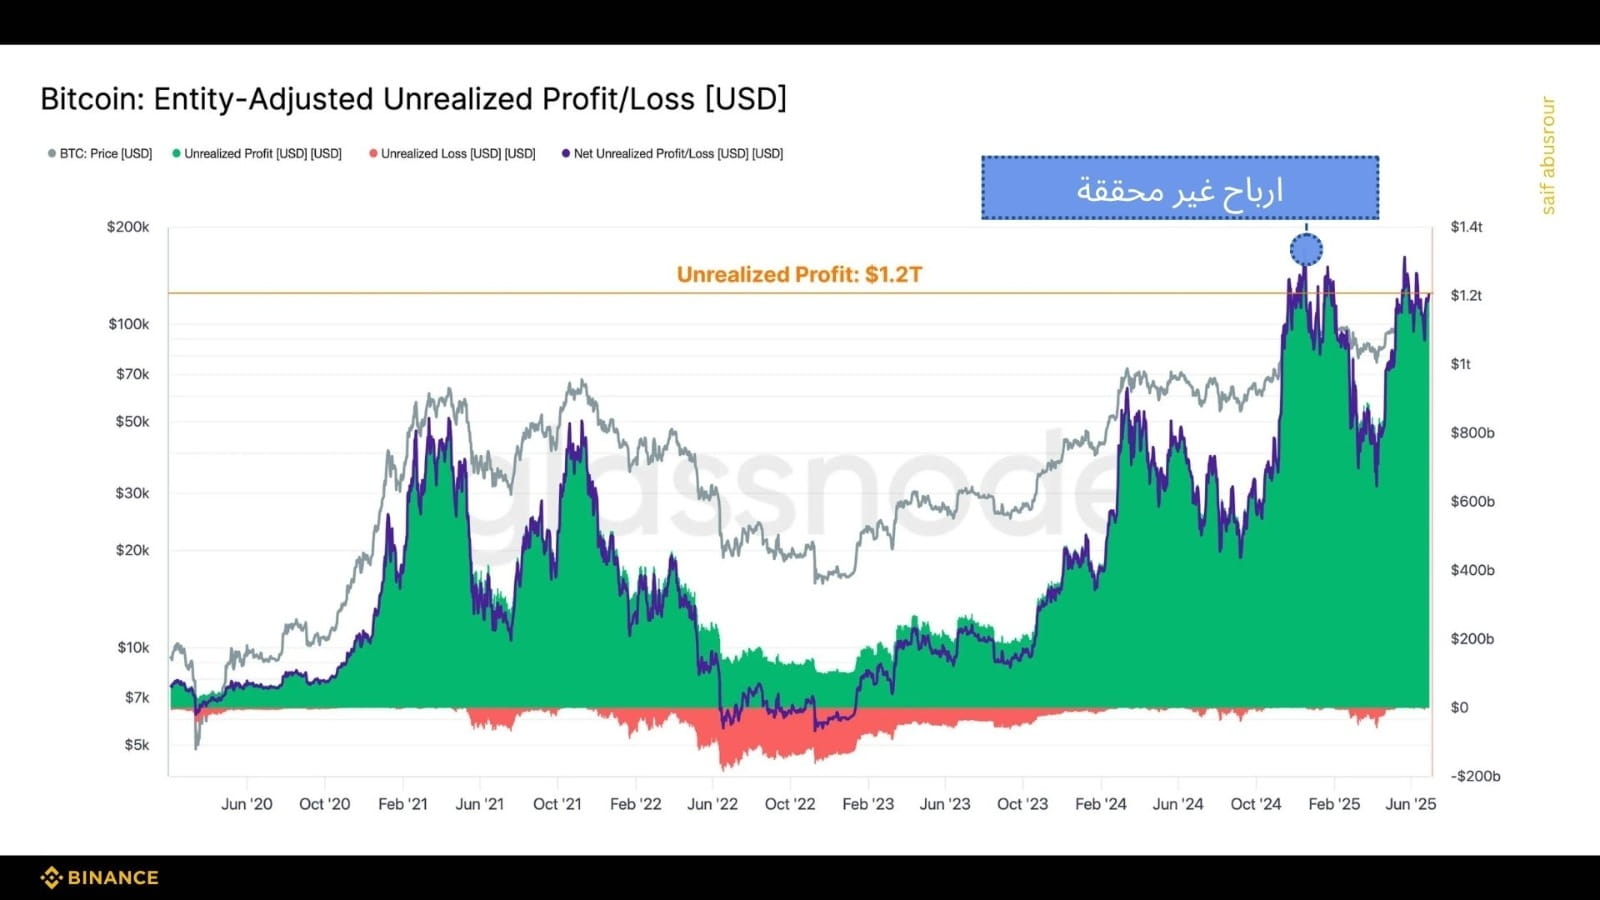
The chart illustrates the state of unrealized profits and losses for Bitcoin holders, based on network data. What we see here is a detailed account of the market situation: the green area represents unrealized profits, meaning that the owners of these coins bought at a lower price than the current price but have not sold yet. In contrast, the red area represents unrealized losses, which are currently almost nonexistent — indicating that the vast majority of Bitcoin holders are in a paper profit position.
In other words, the market today is living on virtual profits only, which have not yet turned into real liquidity. And although these profits reflect a state of optimism and confidence among Bitcoin holders, they also carry a significant psychological risk. The more people who have unrealized profits, the higher the likelihood that they will suddenly start selling at the first sign of fear or a downturn. In other words, current confidence is high but the ground the market stands on is slippery, and these paper profits could turn into a real sell-off in an instant if the general mood changes.
In July 2025, the chart shows that unrealized profits reached about $1.2 trillion, a very large number that approaches the all-time high recorded in the market. This situation is not new; we have seen similar levels at the peaks of 2021 and 2024, and those periods were accompanied by significant price reversals after sudden sell-offs. The idea here is that this massive amount of profits that have not been sold yet represents a hidden pressure on the market: everyone is winning, but if sentiment suddenly turns — due to negative news, political or financial change, or even just a technical correction — holders may start selling all at once to secure profits.
Here the real danger appears. The higher the unrealized profits, the greater the likelihood of a mass sell-off, especially if investors feel that a peak is near or that the market is fragile. Selling in this case is not due to a loss, but due to the fear of losing profit. If this behavior begins, the market can quickly shift from a state of optimism to panic.
The purple line on the chart shows net profits and losses, which is currently rising clearly, indicating that we are in a psychological peak area – the market is full of confidence, but that confidence is fragile. The black line representing the price of Bitcoin is used here as a time indicator for comparison, and historically, whenever the price rises along with unrealized profits, the market is closer to a reversal point.