$BTC 🚀 rebounded, trading between $107K–$110K with a strong 2.3% surge to ~$109.97 — driven by rising volume and ETF inflows .
$ETH rallied ~6% on the day, fueled by institutional demand and spot‑ETH ETF inflows near 106,000 ETH last week .
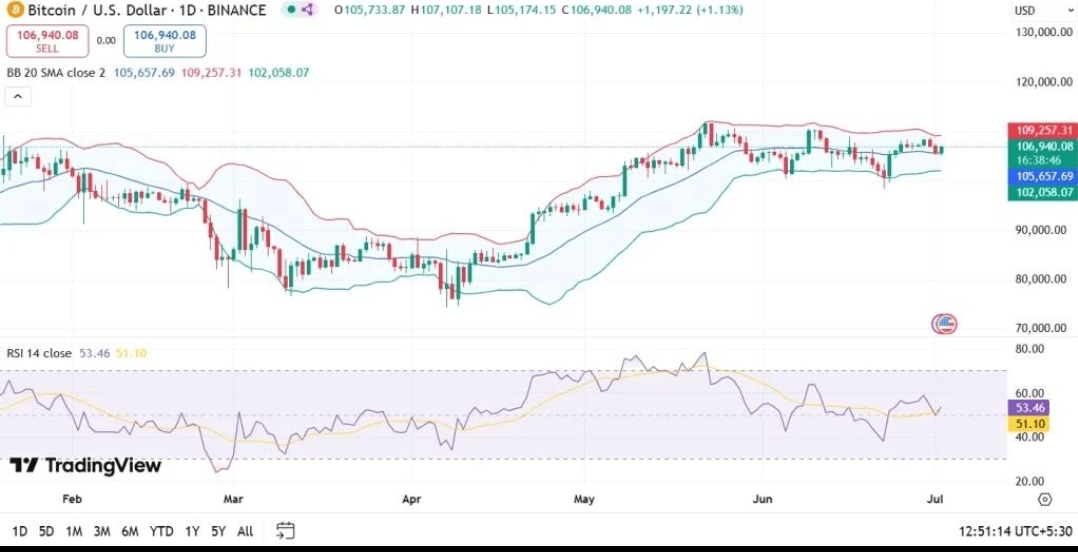
Chart Analysis
BTC/USDT (1D)
Price is consolidating between $104K – $110K, just above the 20‑day EMA, with Bollinger Bands tightening — suggesting an impending breakout .
Key levels to monitor:
Breakout > $109–110K may trigger a move to $113–120K.Abreak below $104K could revisit $101–102K .
ETH/USDT (1D)
$ETH is nestled in a symmetrical triangle, bounded by $2,420–2,550, with narrowing Bollinger Bands .
Institutional flows (6 inflow weeks) support strength, but a whale movement (~237k ETH moved on‑chain) hints at possible short-term volatility .
Key triggers:
Break above $2,550 → next target $2,650+.
Drop below $2,420 → risk revisiti
ng $2,200.
Do you think BTC holds above $110K today? Or will ETH lead the next breakout? Drop your strategies, charts, or ideas below!
#bitcoin #Ethereum #CryptoAnalysis #BinanceSquare #CryptoNews🔒📰🚫


