In trading on Tuesday, July 1, 2025, the technical indicators for Ethereum against the dollar (ETH/USD) show a notable bearish trend after the price has declined by -4.90% so far.
🔍 Quick analytical overview:
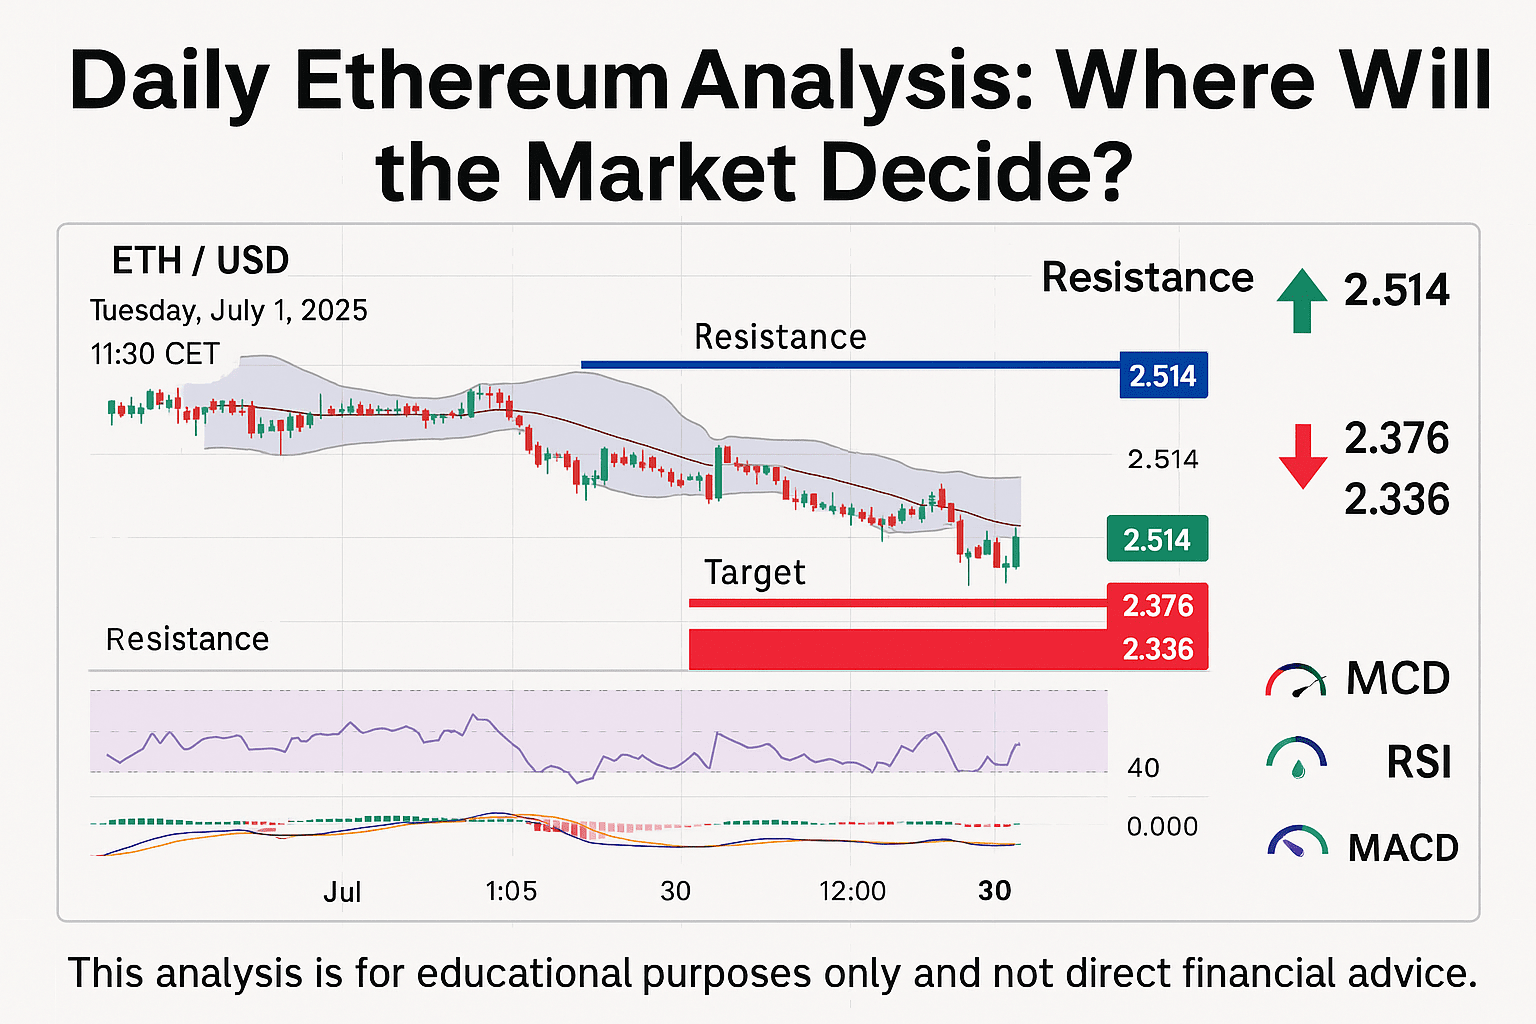
Key resistance: 2,514
Current price: 2,456 (significantly below resistance)
Expected downward targets:
First target: 2,376
Second target: 2,336
📊 Technical analysis:
The current price of ETH is below the strong resistance line at 2,514, which reinforces the likelihood of the downtrend continuing as long as this barrier is not breached.
The moving averages MA 20 + BB and MA 50 indicate weakening bullish momentum.
A potential break of the 2,456 area may open the way to test the areas of 2,376 then 2,336.
⚠️ Alternative scenario: If the price manages to break the resistance at 2,514 and holds above it, we may see an attempt to rise towards 2,581 and possibly 2,620 later.
🧠 Advice for followers: Do not enter the market in a state of confusion. First, follow the break of support or resistance levels, and be cautious of making hasty decisions with significant market volatility.
📌 This analysis is for educational purposes only and does not constitute direct financial advice.

