Half a year ago, I experimented with a 'contract long-short hedging strategy' using a small account on my exchange, with an initial investment of 3000U, and as of now, the profit has reached 230%.
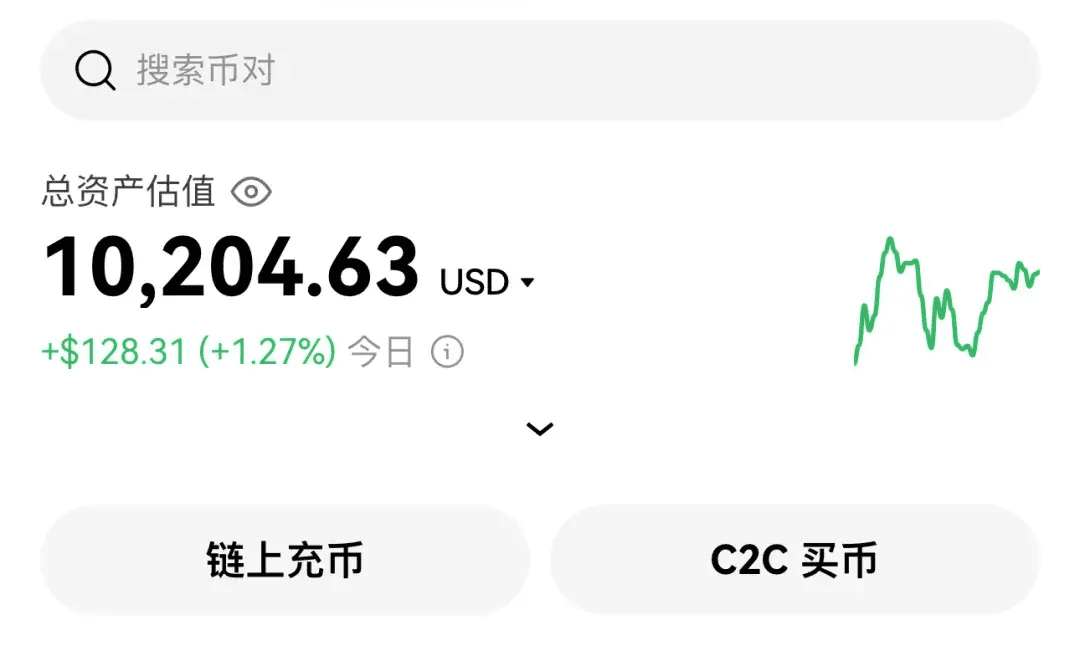
3000U has turned into 10200U.
What is the long-short hedging strategy?
Simply put, it's one order to open Bitcoin.
Long, one order to open Ethereum.
Short (long is bullish, short is bearish).
Two orders with the same leverage and the same position but different coins and different directions.
Method: Use a principal of 3000U to trade, opening one order of 500U long Bitcoin with 20x leverage and one order of 500U short Ethereum with 20x leverage. (Set to full margin)
Based on past experience, we know that when Bitcoin rises, Ethereum usually follows suit, but the rise and fall of the two coins can differ. For example, Bitcoin rises 3%, Ethereum rises 2%, or Bitcoin falls 2%, Ethereum falls 3%…
The long-short strategy profits from the 'difference' between the two.
For instance, you open a long position on Bitcoin and a short position on Ethereum.
If Bitcoin rises by 3% and Ethereum rises by 2%, then you make 3% on your Bitcoin long position while losing 2% on your Ethereum short position. The 1% difference is your profit.
If you opened the wrong direction, you only lost 1%, right? Don't be afraid; the core advantage of the long-short hedging strategy is that even if you open in the wrong direction, you won't get liquidated!
The biggest fear in trading contracts is liquidation.
Someone asked, what if Bitcoin doesn't rise when I'm bullish, but Ethereum keeps rising, resulting in extreme one-sided market behavior?
Rest assured, you still have 2000U left for averaging down; you'll return sooner or later! That's why you only use 500U for a 3000U principal—it's to guard against one-sided market behavior.
After all these years, when have you seen Bitcoin and Ethereum have significant reverse fluctuations?
It can be said that the direction is basically consistent, especially since we still have 2000U in reserve.
What I just said is probably hard for beginners to understand; only those who have played the contracts would know.
(Long-short hedging screenshot)
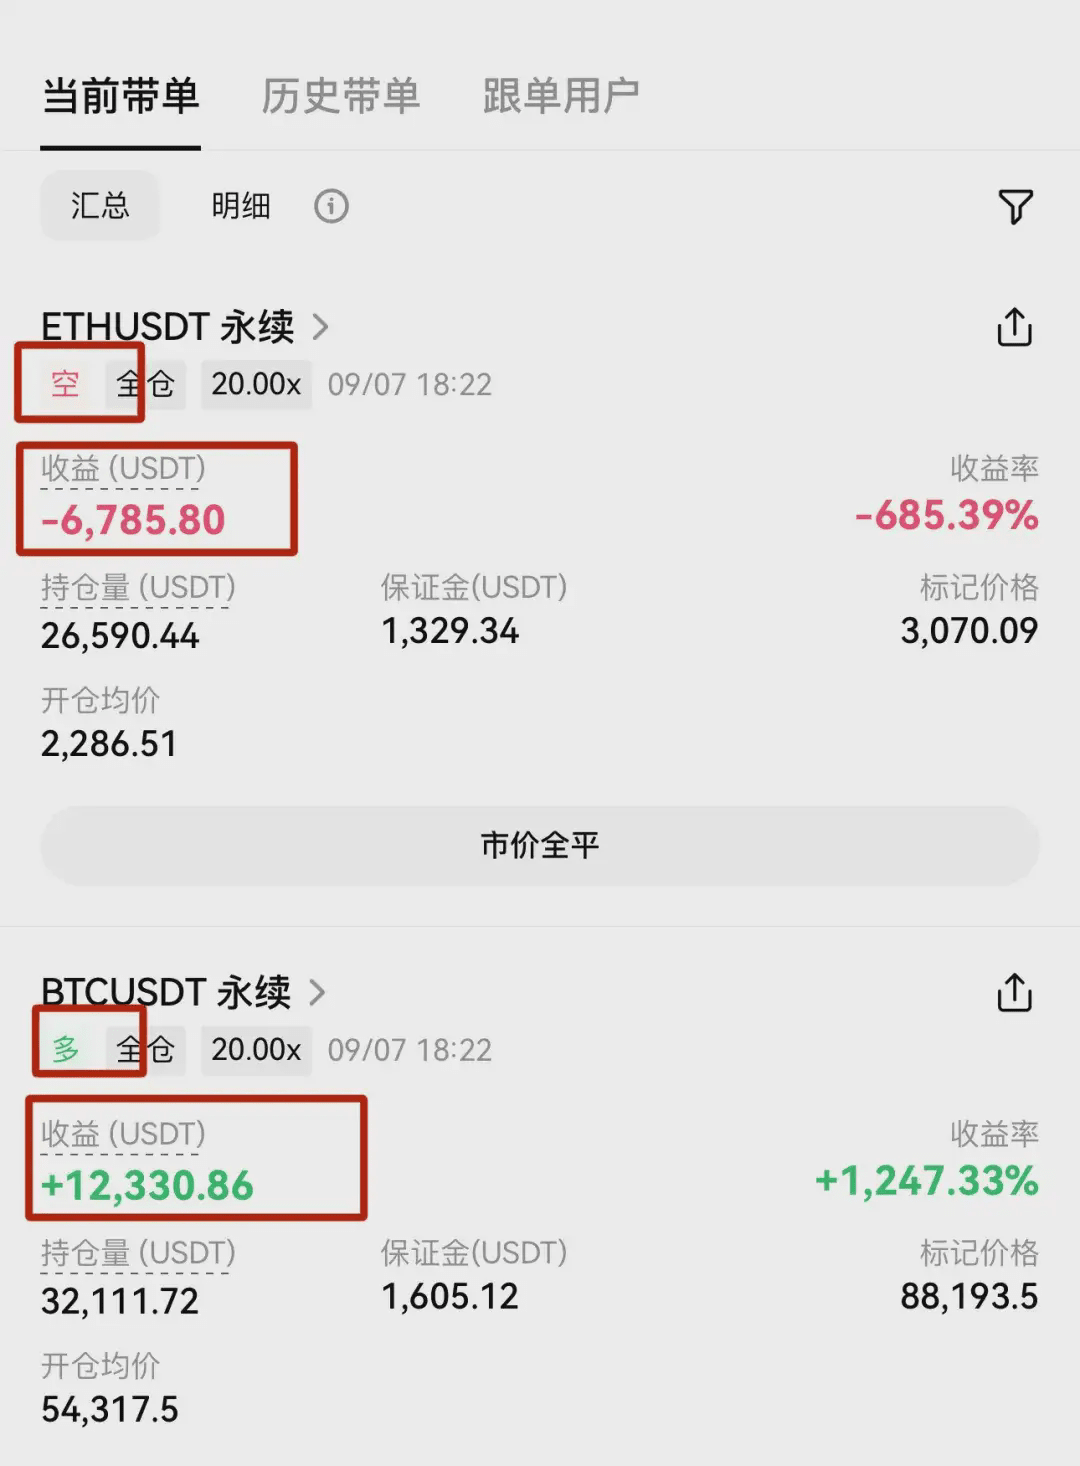
Here is a very important experience.
Bull Market: Bitcoin must rise first to determine the direction of the bull market, then other coins will follow, allowing Bitcoin long positions to earn money first.
Bear Market: Bitcoin must drop less than other coins, so the short positions on other coins will profit more.
Regardless of a bull or bear market, profits can be made.
This is my winning way.
Why short Ethereum?
Ethereum has been weak for the past two years; you must short it unless one day a market trend appears that completely changes its downturn, allowing for long positions.
To play the long-short hedging strategy, you need to have a roughly accurate judgment of future trends and an understanding of the value of each coin at a certain stage.
Why choose Bitcoin and Ethereum for shorting?
Because you must hedge with two currencies that have similar values! If you use Bitcoin and Shiba Inu, it is easy to encounter one-sided market behavior. When Bitcoin rises, Shiba Inu does not rise; when Bitcoin falls, Shiba Inu plummets, which can lead to liquidation.
Top coins can only hedge against top coins; top coins against junk coins will only lead to liquidation.
"Long-short hedging" is just a strategy, not a guaranteed profit. To make money, you still need to rely on your own experience and judgment. When your judgment is correct, it will allow you to profit, and when your judgment is wrong, it won't let you lose too much.
Let me share a set of my own practical strategies accumulated over the years, with an average win rate of 80%, which is quite a remarkable achievement in the cryptocurrency trading world.
With just this one trick (the bullish triangle flag pattern), the win rate can be as high as 99%, suitable for everyone! This is also the core wealth code for my monthly income in seven figures and annual income in eight figures.
The bullish triangle flag is a chart pattern formed during price pullbacks.
This pattern is considered a powerful and adaptable technical analysis tool, providing investors with an opportunity to buy at relatively low prices during the prevailing uptrend in the market.
The purpose of this guide is not to explain the basic concept of a bullish triangle flag, but rather to teach how to use this chart pattern in trading to achieve profitability in the market. After reading the complete content, you will immediately grasp the practical knowledge of applying the bullish triangle flag pattern for market operations.
What is the bullish triangle flag pattern, and how does it compare with other patterns?
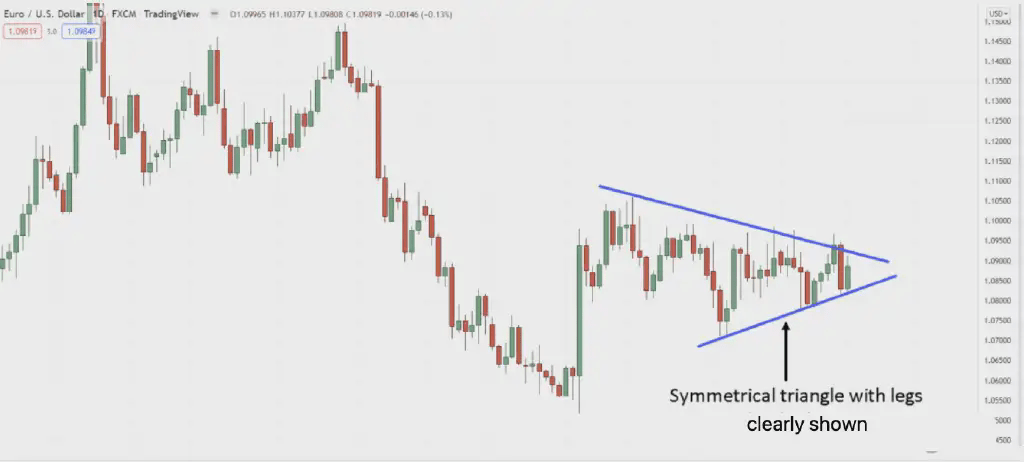
First, I believe you already have some understanding of the symmetrical triangle pattern. However, there are significant differences between the bullish triangle flag and the symmetrical triangle. In short, this difference mainly manifests in their duration.
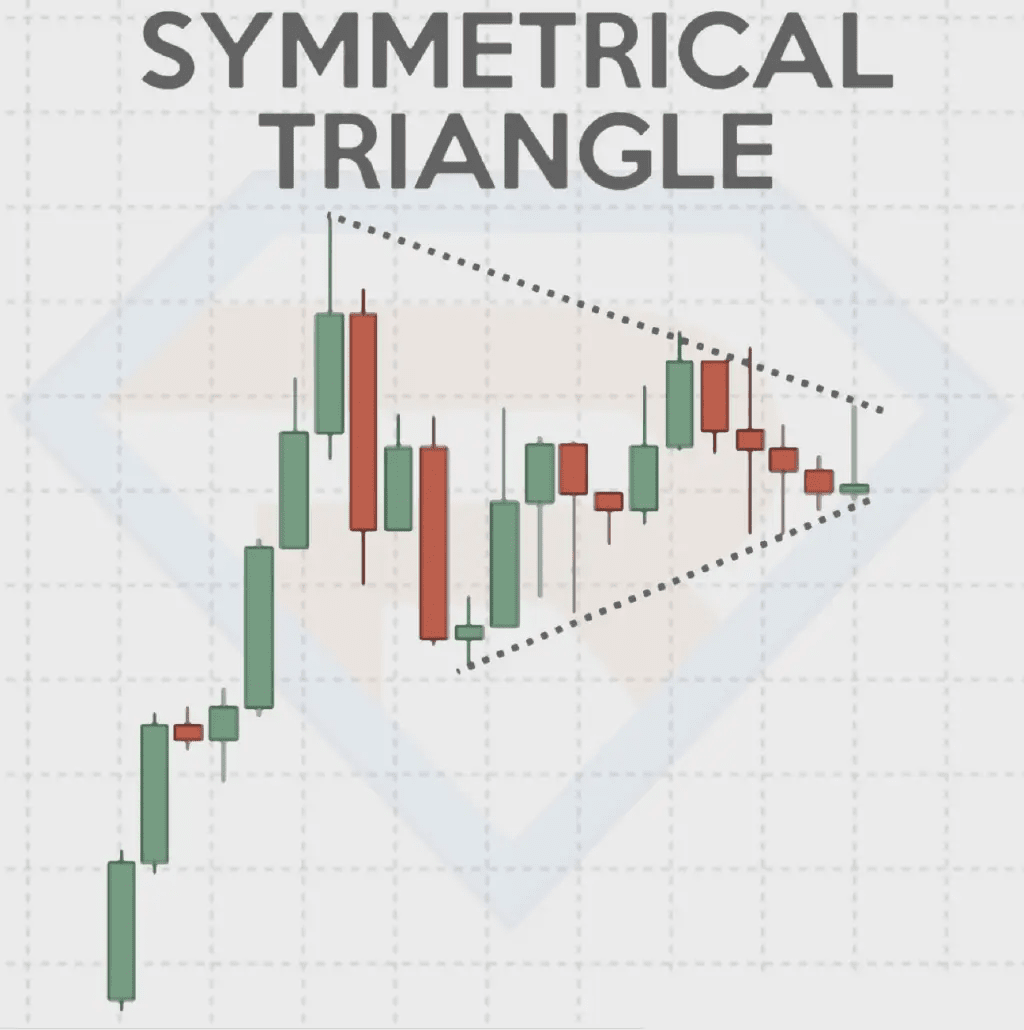
When observing the symmetrical triangle, you will be able to recognize the fluctuations in the pattern and the so-called 'swings' and 'legs', as demonstrated in the current example, as shown in the figure below.
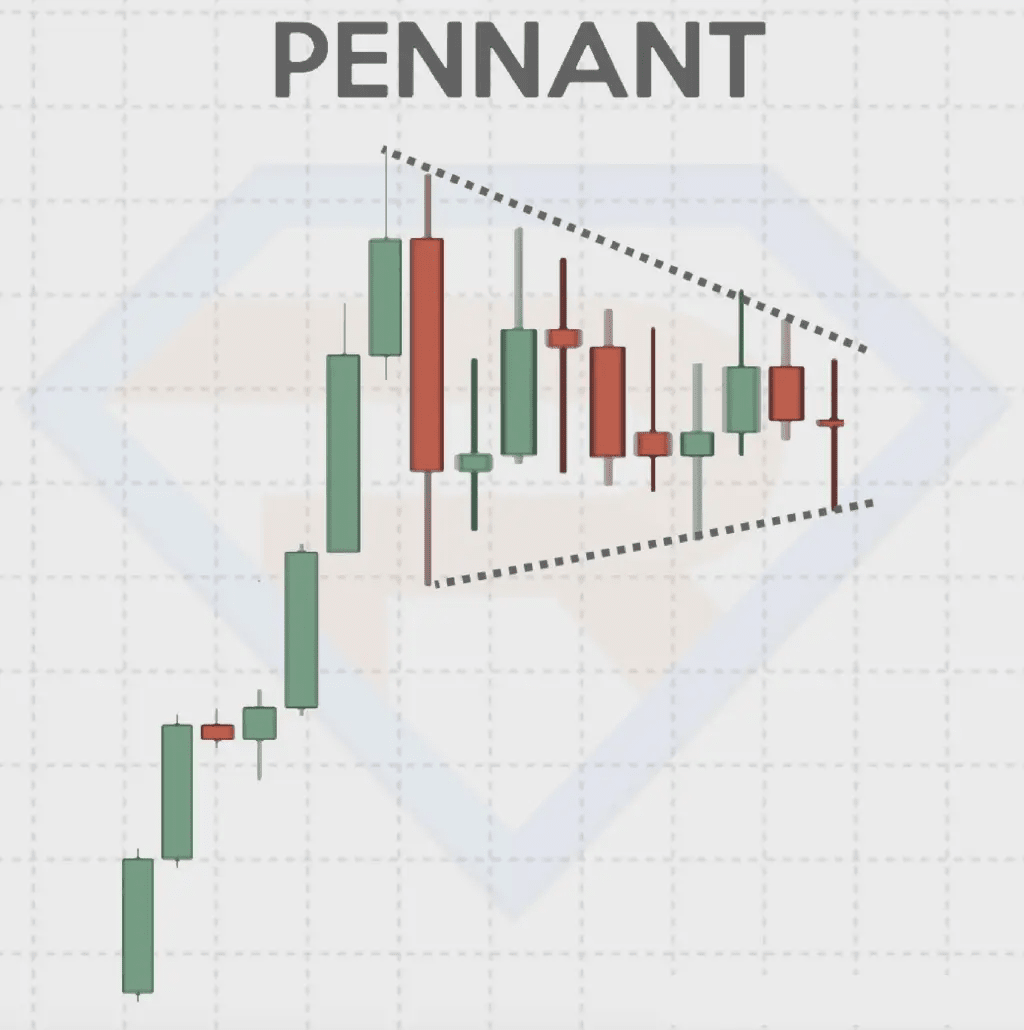
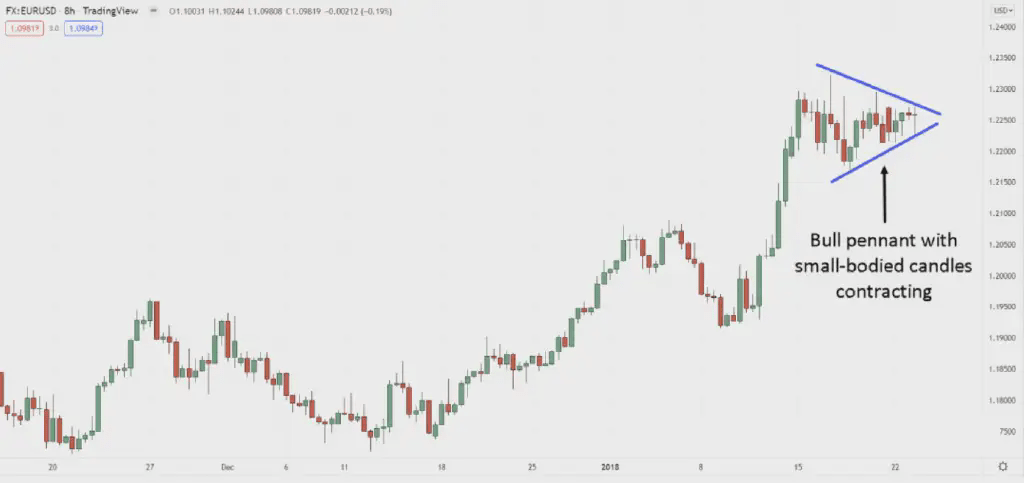
However, in the bullish triangle flag pattern, the performance of candlestick charts shows a dense arrangement and significant fluctuations, making it difficult to identify the pattern's swings and legs, as shown in the figure below.
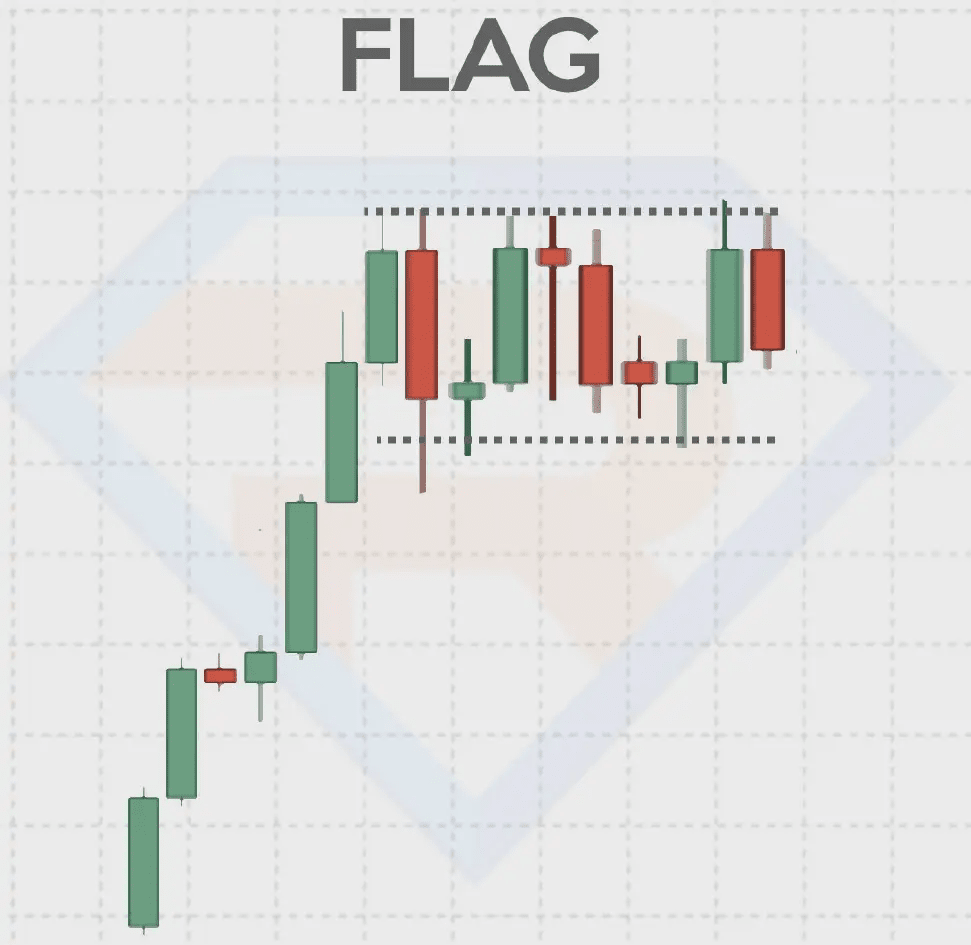
Nevertheless, the bullish triangle flag is more similar to the bullish flag pattern, as shown in the figure below.

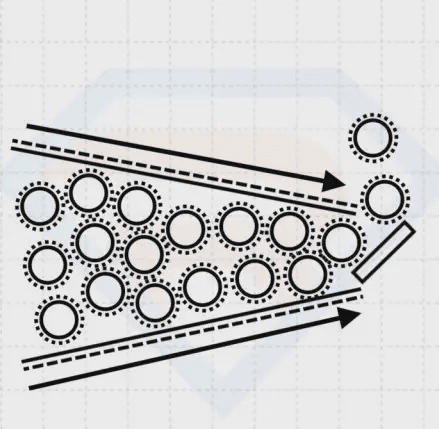
The bullish triangle flag pattern often results in more 'violent' breakouts compared to the bullish flag pattern. Imagine a conference room filled with many people; suppose they are all eager to leave the room, whether due to the desire to go home or the need to use the restroom. If there is a spacious door for them to evacuate, what would happen? As shown in the figure below.
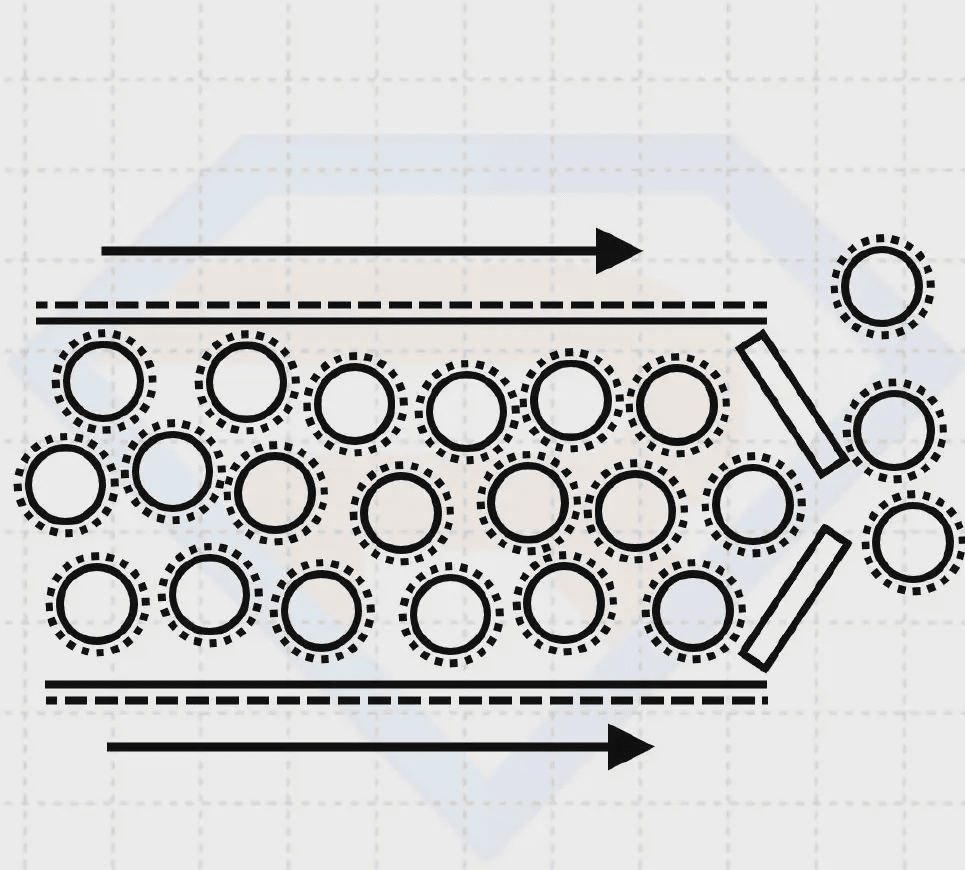
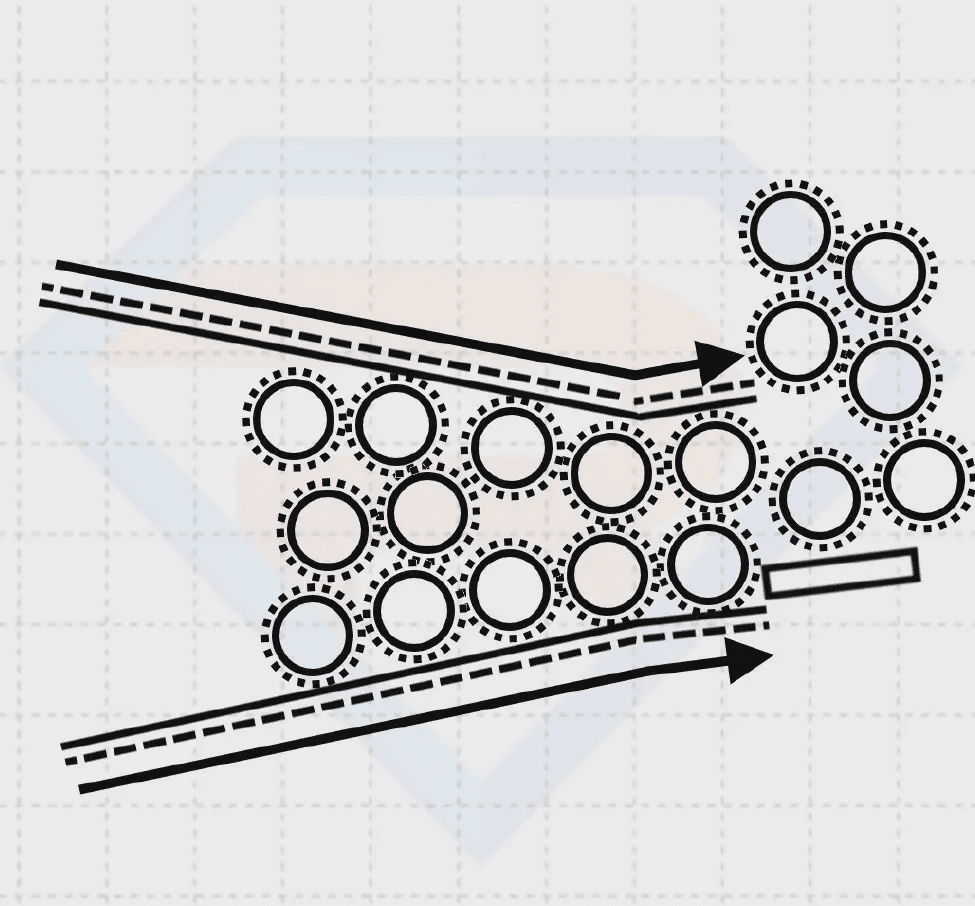
Now, imagine that every member in the conference room wishes to leave, but as they move toward the exit, the corridor gradually narrows, and the exit door is relatively small, as shown in the figure below.
You might speculate what might happen; the participants may feel anxious and unsettled, and they may question: What's going on? Why have we taken so long to evacuate? I urgently need to use the restroom; please speed it up. What might happen next? It can be anticipated that people may enter a state of agitation, and they may take drastic measures to open the exit, possibly even using physical force to break through obstacles, as shown in the figure below.
In the bullish triangle flag pattern, the behavior of buyers and sellers is similar. This sign of impending volatility is evident as both buyers and sellers are eager to break free from the constraints of price pullbacks. Therefore, you might wonder: I have understood this concept; how should I start trading this pattern to achieve immediate profits? However, the situation is such that merely understanding how to trade this pattern is insufficient if you do not know how to avoid erroneous trading methods. Therefore, I will first reveal common misconceptions when using this pattern, and then introduce strategies to profit from it.
Mistakes to avoid when trading the bullish triangle flag pattern
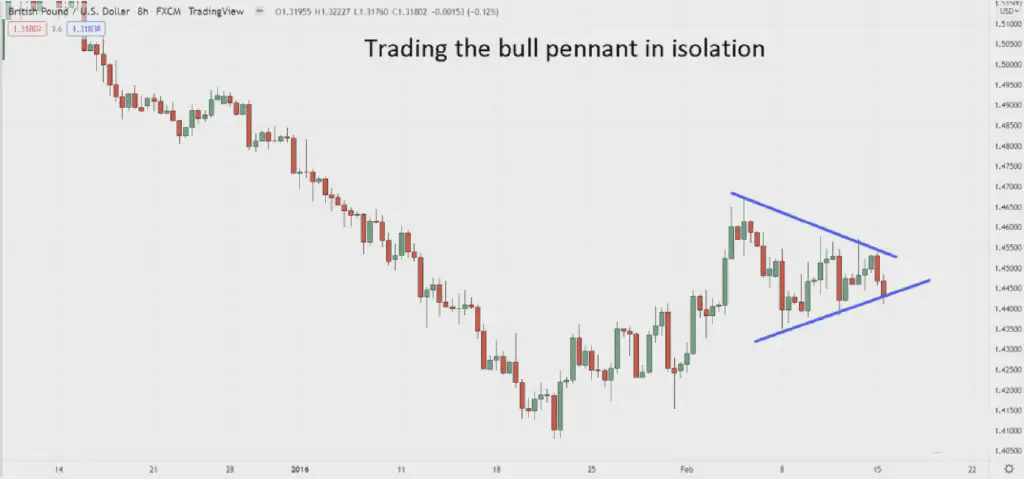
(1) Error 1: Trading the bullish triangle flag pattern in isolation.
The bullish triangle flag pattern consists of two main parts: the sprint action (also called the 'leg') and the price adjustment phase, as shown in the figure below.
However, if you intend to trade this relatively minor pattern in the face of a severe downward trend, what do you think the result will be? As shown in the figure below.
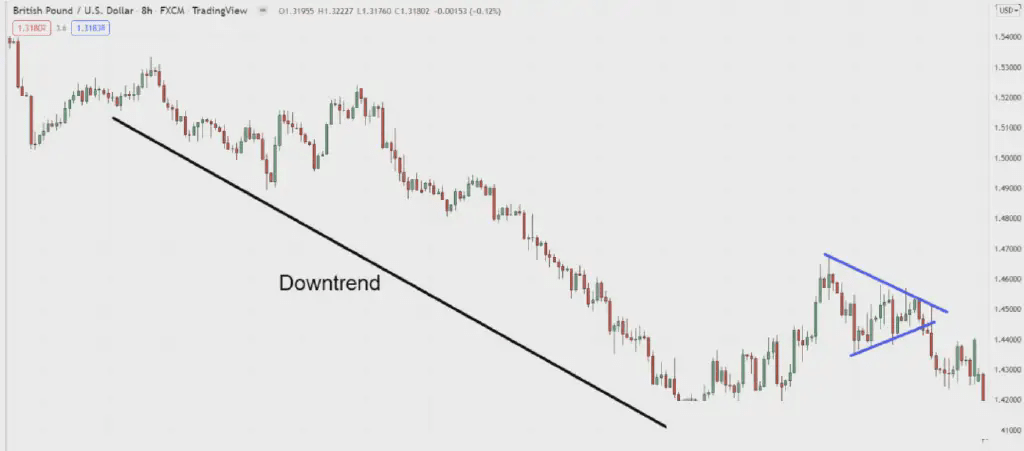
It is highly likely that in such cases, the pattern will not succeed, and the market's downward trend will continue. However, if you trade the bullish triangle flag pattern while the overall market shows an uptrend, you will find it easier to manage and optimize your trades, thus increasing your chances of profiting from the market, as shown in the figure below.
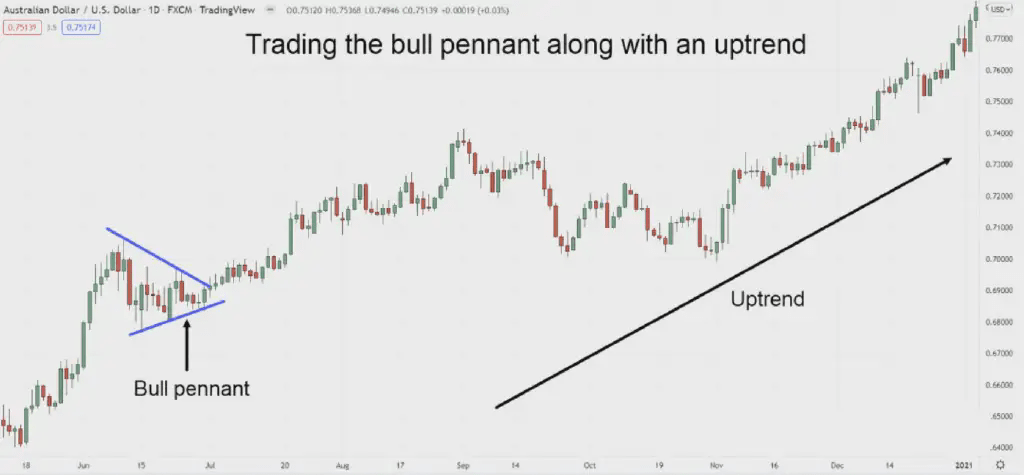
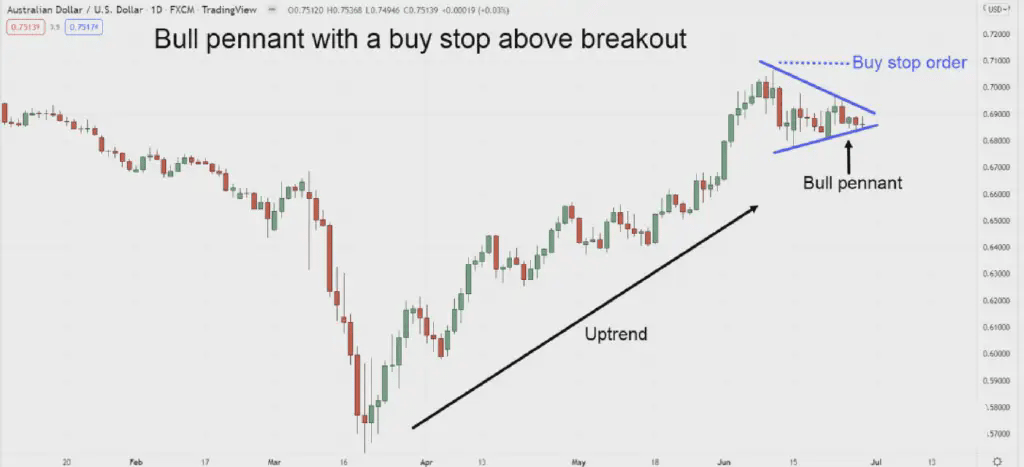
Therefore, the next time you identify a bullish triangle flag pattern, please use the following checklist for reference: Am I considering trading an effective bullish triangle flag pattern? Am I trading this bullish triangle flag pattern in an uptrend? However, how exactly do you plan to enter the bullish triangle flag pattern trade? Have you set your entry rules? If the answer is no, then how do you enter the bullish triangle flag pattern trade correctly? You should place a buy stop-loss order above the breakout point, as shown in the figure below.
(2) Error 2: Entering the bullish triangle flag too early.
As you understand, trading during range markets or price pullbacks can become complex for two reasons: the price range may exceed expected limits or fall below expectations, as shown in the figure below.
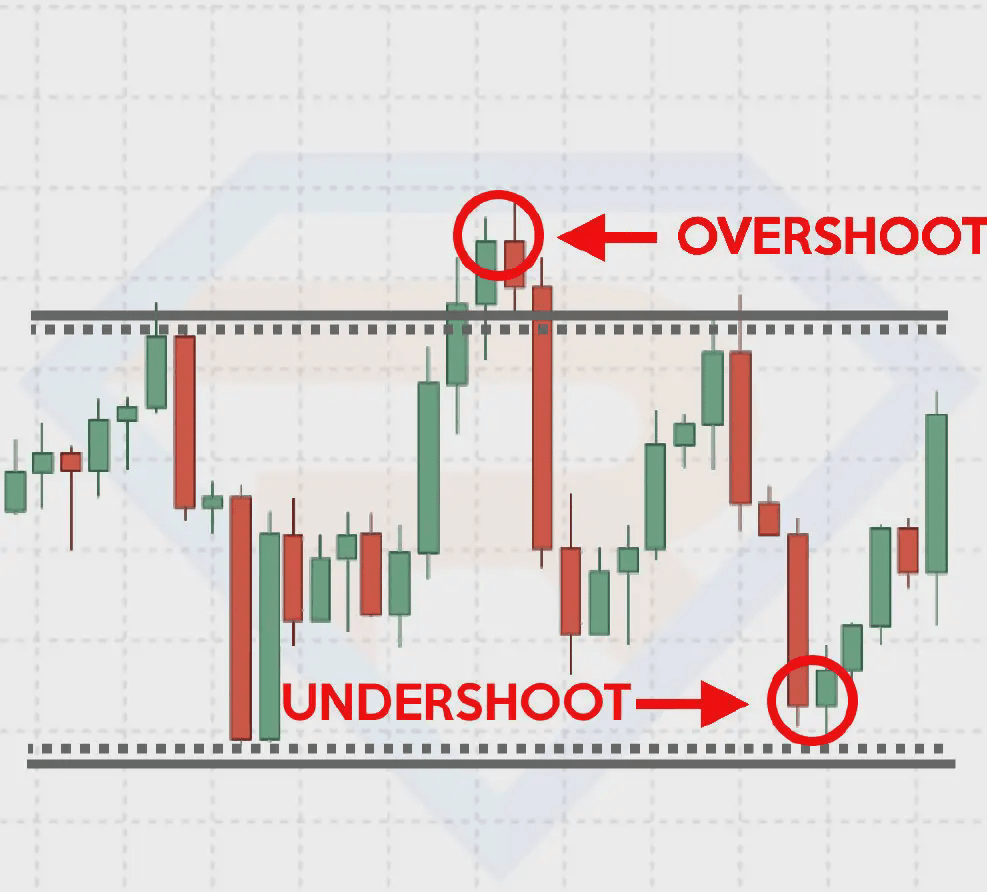
Therefore, if you set a buy stop-loss order above the price swing high, the following situation may occur: the price may easily reach your buy stop-loss order and then quickly reverse back to the established price range (i.e., a deviation occurs), as shown in the figure below.
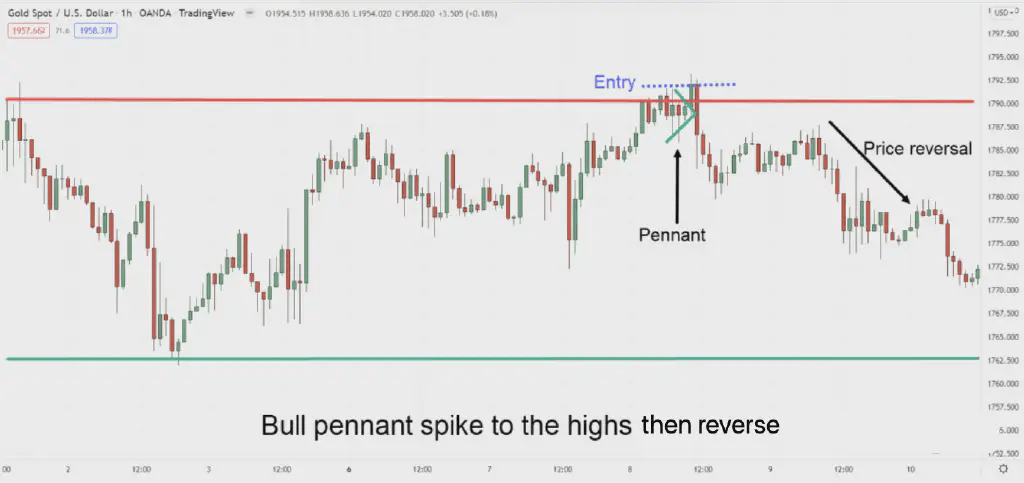
So what is the solution? Wait for the bullish candle to close above the triangle flag, as shown in the figure below.
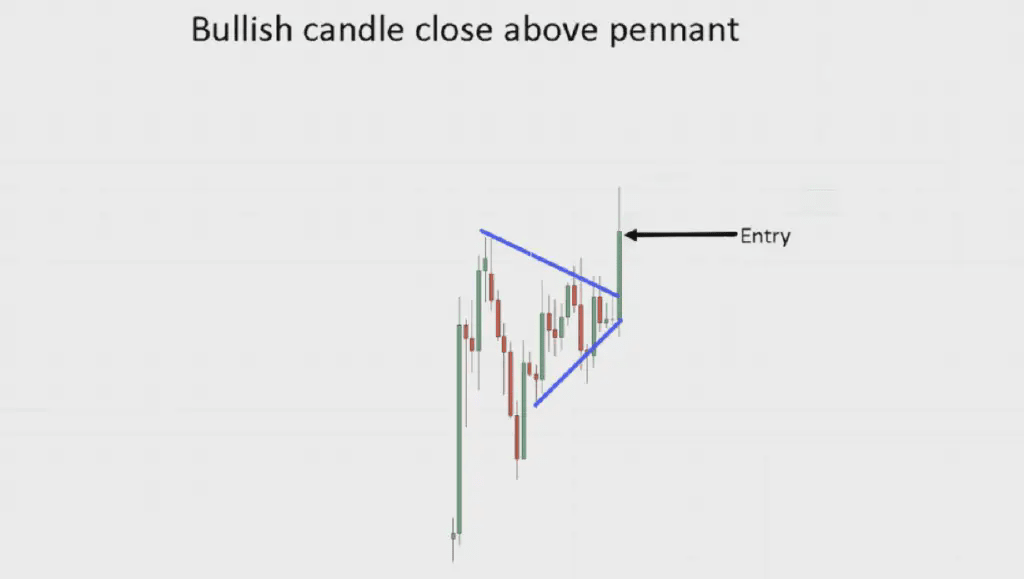
If the market price exhibits the described action, it clearly indicates that the buying power that was previously in an "oppressed" state has finally erupted. Just like the example I provided earlier, you should ensure that the audience in the conference room feels panicked in face of the situation, not daring to leave through that narrow exit.
At this stage, you already have a deep understanding of the operating principles of the bullish triangle flag pattern and its entry timing. However, does this constitute a complete trading strategy? The answer is no. In the following content, I will guide you on how to use the bullish triangle flag pattern for trading under different market conditions. However, before we delve deeper, I suggest you have a certain level of knowledge in price action analysis.
Effective bullish triangle flag strategies in trend and range markets.
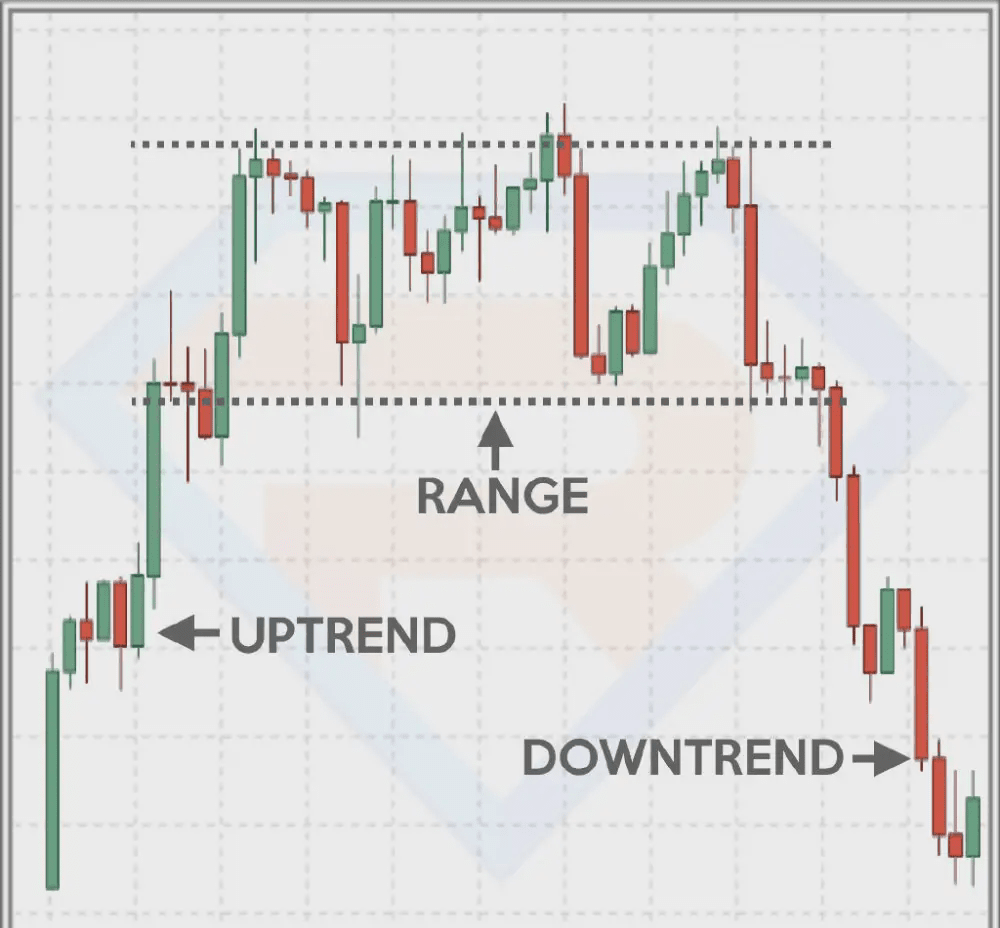
First, let’s explore the different classifications of market conditions, which can be mainly divided into the following three types:
(1) Uptrend: In such markets, prices show a clear upward trend.
(2) Range oscillation: In such markets, prices fluctuate within a specific range without a clear sustained upward or downward trend.
(3) Downtrend: In such markets, prices generally exhibit a downward trend.
These market conditions have distinct characteristics in their chart representation, as shown in the figure below.
So, how do we operate under these different market conditions to achieve profitability? Next, let me show you specific strategies and methods.
(1) Uptrend
First, you must master how to objectively identify an uptrend. If you cannot accurately define the market trend, then the trading strategy based on the bullish triangle flag pattern may encounter failure. So, what measures should be taken? We can achieve this goal by applying trend filters, such as using the 50-period moving average, as shown in the figure below.
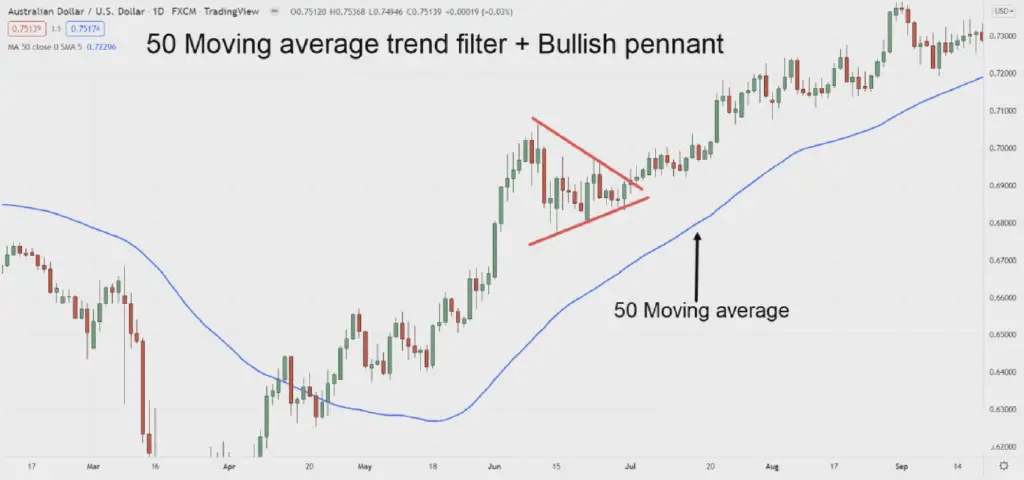
If the market price is above the 50-period moving average, we begin to look for trading opportunities in the bullish triangle flag pattern. Conversely, if the market price is below the 50-period moving average, we should avoid trading. When the market presents an opportunity for a bullish triangle flag pattern, how should we operate? In this case, we need to wait for the price to form a bullish candle and close while setting a stop-loss point below the bullish triangle flag pattern, as shown in the figure below.
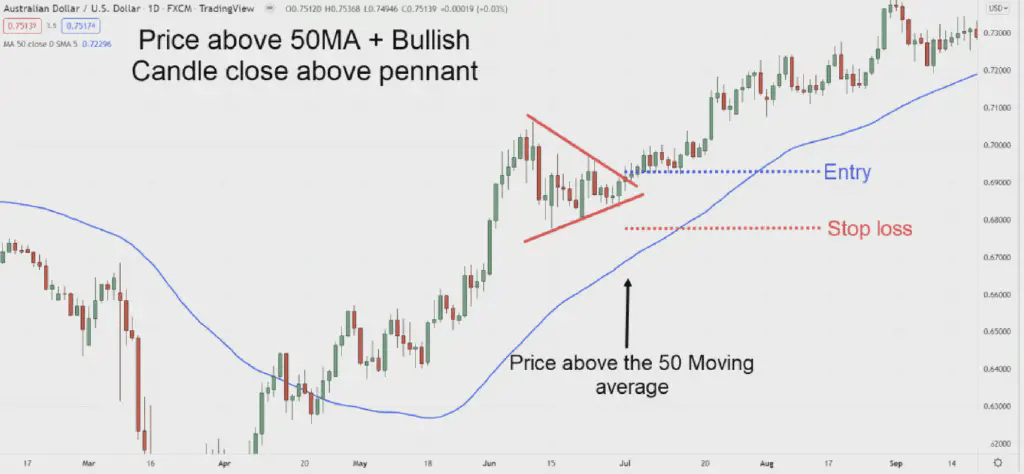
How to achieve profitability? The process is relatively straightforward. Given that we cannot predict how long market trends will last, we can use the 50-period moving average to dynamically adjust stop-loss positions. Therefore, our exit strategy is to only end the trade when the price closes below the 50-period moving average, as shown in the figure below.
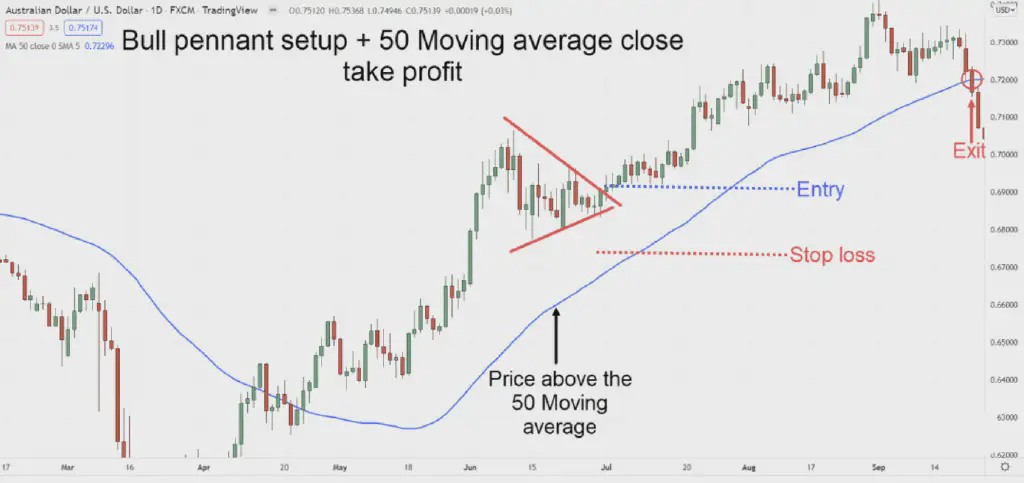
We not only use the 50-period moving average as a trend filtering tool but also apply it to profit acquisition strategies. This method can be described as 'killing two birds with one stone', achieving dual purposes with a single tool.
(2) Range oscillation.
Given that the bullish triangle flag pattern is a trend continuation pattern, it is implicitly assumed that market conditions unfavorable to such setups are excluded.
So, how should we trade in a range oscillation market? In fact, our strategy is to avoid trading in range markets, meaning we will not attempt to buy or sell at the top and bottom of the range. Instead, we will stay on the sidelines as the range market is about to end, for instance, looking for a bullish triangle flag pattern forming at the resistance level as a potential trading signal, as shown in the figure below.
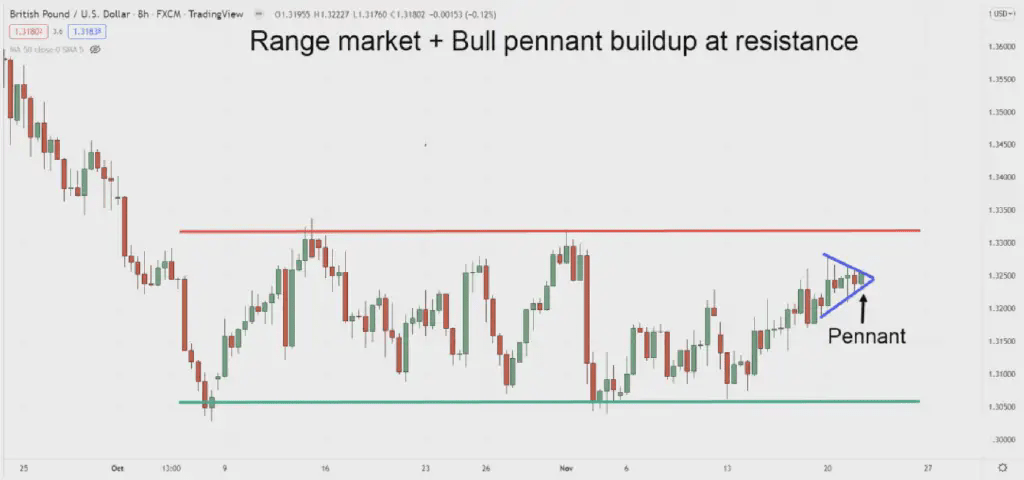
When you observe the bullish triangle flag pattern forming at resistance, this signal indicates that buying power is increasing, and the market may soon experience a significant breakout. Although we expect the market to break through the current range, at this stage, the market has not yet formed a clear effective trend.
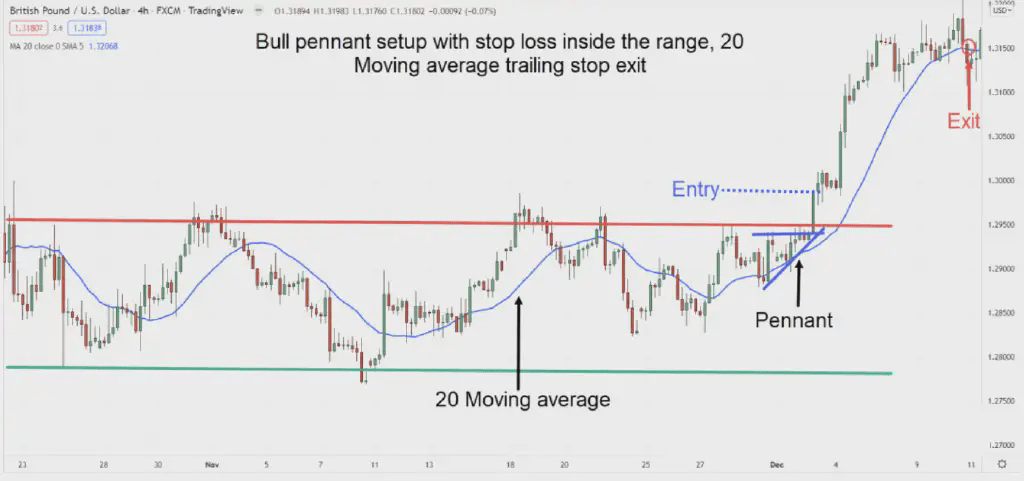
Therefore, to guard against price breakouts, it is advisable to use shorter-period moving averages, such as the 20-period moving average, to adapt to the dynamic changes in the market, as shown in the figure below.
(3) Downtrend.
You may have questions: You previously mentioned that the bullish triangle flag is a trend continuation pattern; why would we apply it in a downtrend?
Allow me to present a possibility: Is there a way to achieve profitability in a downtrend while still using the bullish triangle flag as a continuation pattern? Here’s a simplified two-step strategy: first, the price must close above the trendline resistance. Second, the price must form a bullish triangle flag pattern above the trendline, seeking specific setups within a downtrend to utilize the bullish triangle flag pattern for reversal trading opportunities, as shown in the figure below.
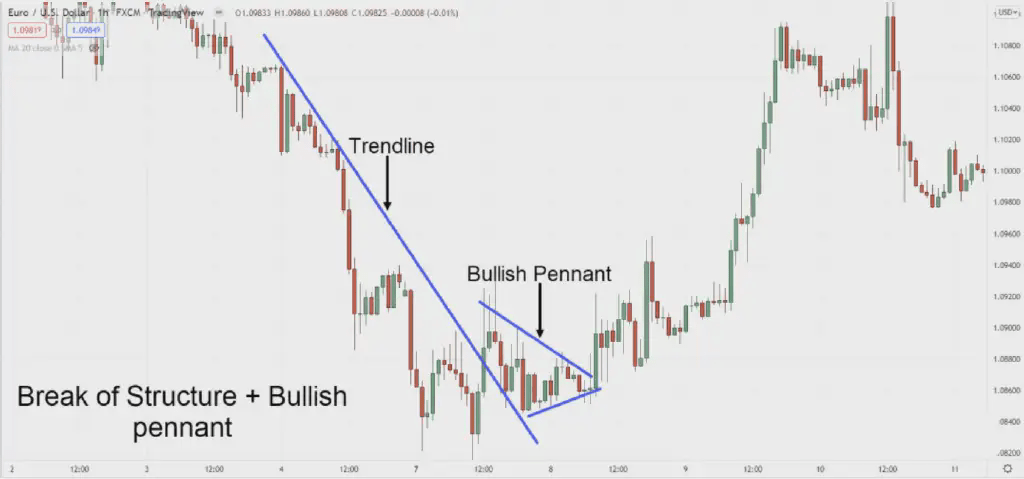
This strategy is quite clever; what you are implementing here is trading between the ending downtrend and the possible beginning of an uptrend. Of course, you can also use the bearish triangle flag pattern (the opposite of the bullish triangle flag) to trade in accordance with the market trend. Nevertheless, similar to the range market strategy, I still recommend that you adopt a strict trailing stop-loss method, such as using the 20-period moving average to manage risk, as shown in the figure below.
Summary
The following is a summary of the key points of this guide:
(1) The bullish triangle flag pattern consists of a series of small candlesticks with gradually decreasing volume.
(2) In trading the bullish triangle flag pattern, always analyze in conjunction with the market's price behavior.
(3) The bullish triangle flag pattern can be applied in trading strategies during uptrends, range oscillation markets, and downtrends.
For beginners, I share a few life-saving tips learned from practical experience:
——
1. Trading after nightfall, after 9 PM
During the day, the information is complicated and hard to discern. The market is like willows in the wind, unpredictable, and easily misleads beginners into the wrong path.
I usually enter trades after 9 PM when the information settles down, and the K-line trend is clear and direction is obvious. #Crypto Trading Diary
——
2. Lock in profits immediately.
Do not be greedy for the joy of doubling! Suppose you earn 1000U today, I suggest you immediately withdraw 300U to your bank account and continue playing with the rest.
I have seen too many tragedies of 'greed leading to total loss'.
——
3. Indicators are king; discard intuition.
Intuitive trading is no different from a blind person touching an elephant.
Install TradingView on your phone and carefully examine the following indicators before trading.
• MACD: Golden cross and death cross show signs.
• RSI: Overbought and oversold hide secrets
• Bollinger Bands: Constricted breakout determines direction
At least two indicators must synchronize before considering entering.
——#币圈暴富
4. Flexibly respond to stop-losses.
When monitoring the market, if you are profitable, manually adjust the stop-loss upward. For example, if the purchase price is 1000, rises to 1100, adjust the stop-loss to 1050 to lock in profits.
If you need to go out and cannot monitor the market, be sure to set a hard stop-loss at 3% to guard against the unexpected.
——
5. Withdraw profits every Friday without fail.
Unwithdrawn profits are just digital bubbles.
I withdraw 30% of my profits to my bank account every Friday, and continue to roll over the rest. Over time, my account grows increasingly richer.
—#Get Rich in Crypto
6. K-line reading has skills
• Short-term operations, focus on the 1-hour chart: consecutive bullish candles signal a long position.
• Market consolidating, switch to 4-hour chart: Consider entering near the support line.
——
7. Pitfall guide
• Leverage should not exceed 10 times; beginners should control it within 5 times.
• Be cautious with altcoins like Dogecoin and Shiba Inu; they are easy to get burned.
• Daily trades should not exceed 3; too many can lead to loss of control.
• Remember, do not borrow money to trade cryptocurrencies.
——$BTC
Conclusion gift to you:
Trading cryptocurrencies is not gambling; treat it as a job, clock in and out, and turn off your phone to enjoy life. Thus, you will find your path to wealth increasingly stable.
