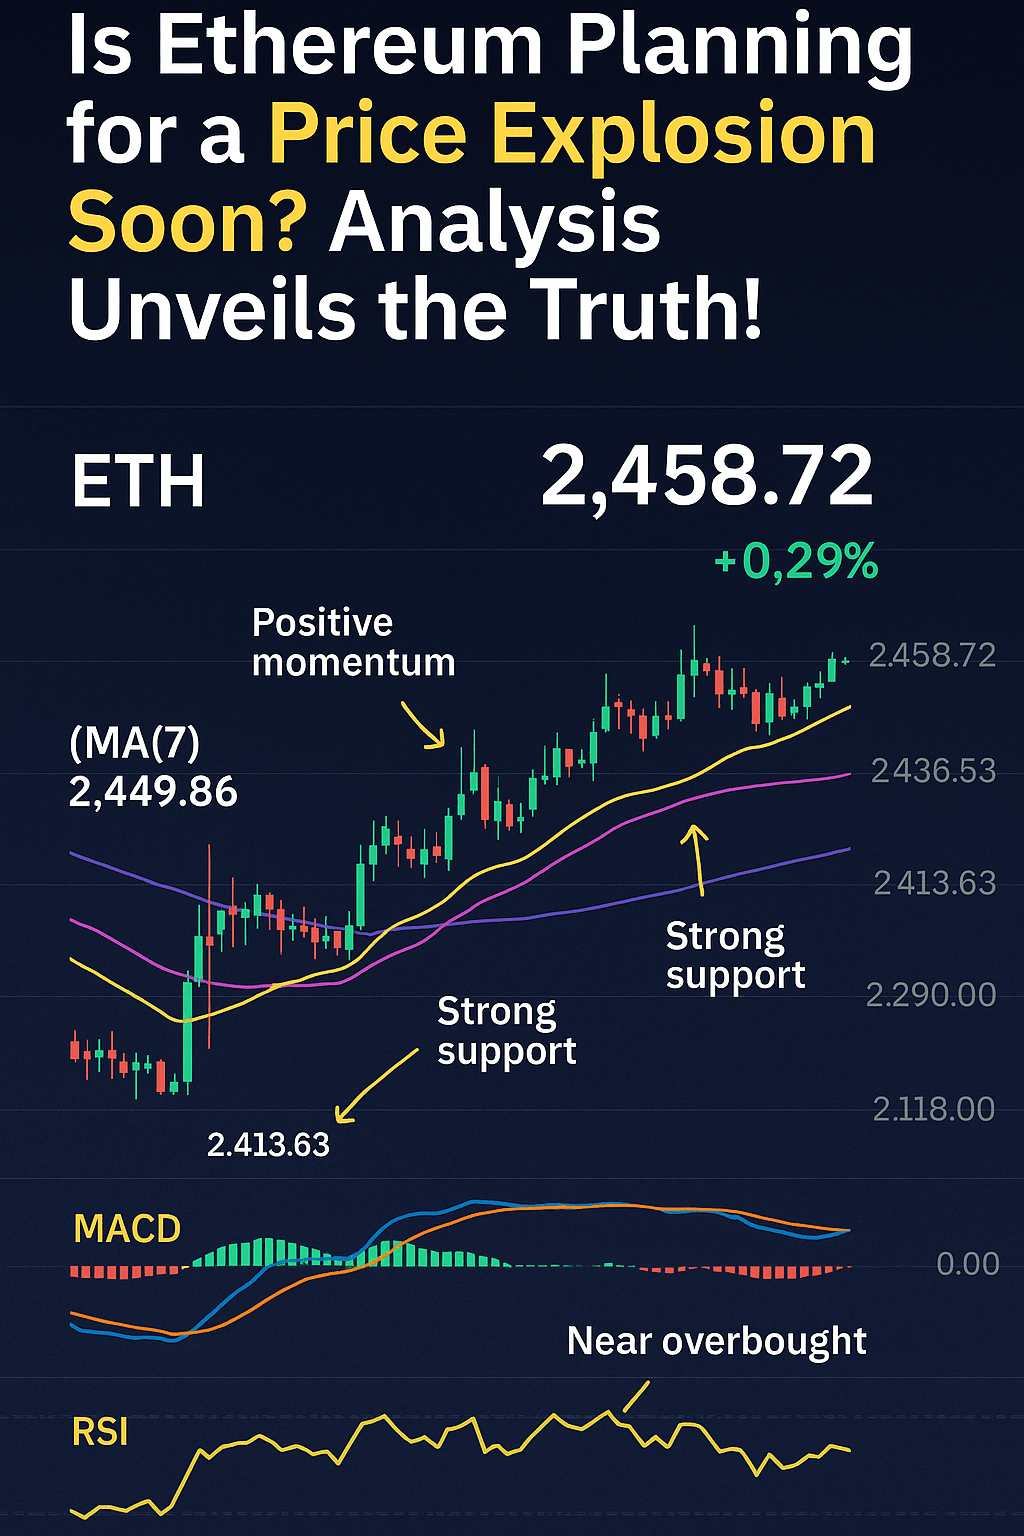
📊 Current price: 2,458.72 USDT
📉 Percentage change: -0.29% over 24 hours
Ethereum is moving quietly, but the charts say something completely different!
🧠 Accurate technical analysis:
✅ Moving averages (MA):
MA(7): 2,449.86 → Price is above it (short-term positive momentum)
MA(25): 2,436.53 → Strong support on the short time frame
MA(99): 2,413.63 → Previous resistance turned into strong support
📈 MACD Indicator:
Positive bullish crossover (MACD: 3.71)
Signal of a coming driving force, but needs higher trading volume for confirmation
📉 RSI(6): 65.59
Close to overbought → Beware of any sudden correction!
📊 Trading volumes:
Still weak, indicating that the market is waiting for a surprising event to move the price
🔍 Key upcoming scenarios:
🔼 Positive scenario:
A clear breakout of the 2,467 level could push the price towards 2,500 then 2,520
🔽 Negative scenario:
Breaking 2,436 could bring the price back towards 2,391 and possibly lower
💡 Is it the right time to enter?
The analysis indicates positive momentum, but caution is required...
Wait for confirmation of trading volume or a break of resistance before making any entry decision.
🗨️ Share with me in the comments:
Do you expect an upward movement or a correction for Ethereum?
In your opinion, will ETH break 2,500 before the end of the day?
👇 Share your opinion and let's discuss
📌 Important reminder:
This analysis is for educational purposes only and does not represent direct financial advice.
Always conduct your own research before making any trading decision.
