#MarketSentimentToday #marketrebounds

BTC/USDT Perpetual Chart Analysis (1H Timeframe) - June 27, 2025
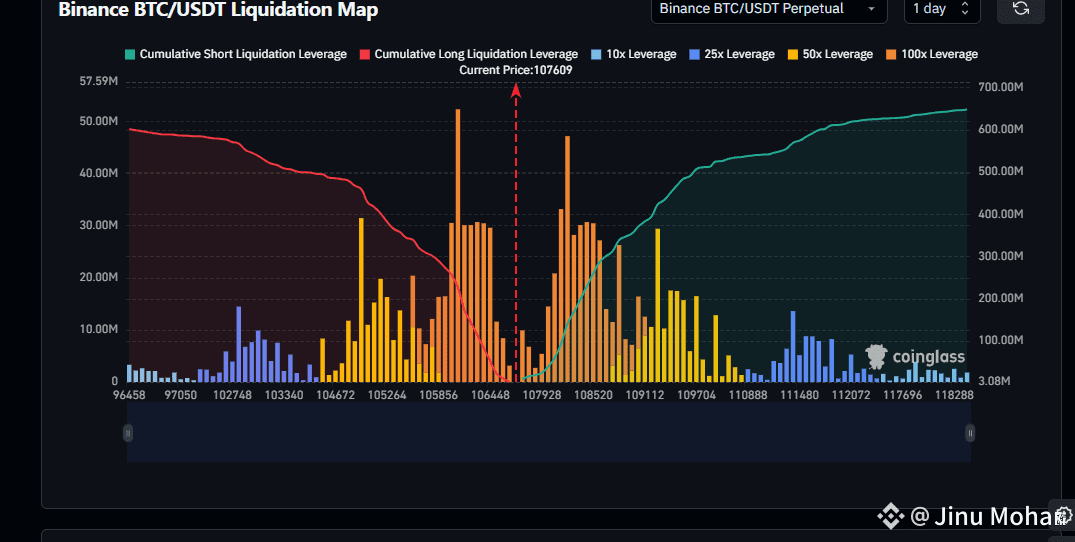
Check out this BTC/USDT liquidation map and chart! A gap zone forms between $10,743.95 and $11,195.69 (red lines). Let’s break it down with advanced technical insights:
Gap Zone Analysis:
The gap from $10,743.95 to $11,195.69 suggests a liquidity sweep, likely from stop-loss hunting or dark pool activity. This could act as a major support/resistance zone.
Liquidation Map: The spike in long liquidations (red) around $10,743.95 and short liquidations (green) near $11,195.69 indicate heavy leveraged positions being cleared.
Order Flow & Liquidity Heatmaps:
The gap aligns with a Low Volume Node (LVN) around $10,743.95, a low-liquidity area price might retest. Watch for a bounce or break.
Order Blocks: A bullish order block could form near $10,042.21 (green zone) if buyers step in, while $10,743.95 might be a bearish order block on rejection.
Market Profile & Auction Theory:
The Point of Control (POC) near $10,472.29 marks the fair value area. The gap zone sits above the Value Area High (VAH), suggesting potential resistance.
Delta Ladder: Positive delta near $10,042.21 could signal buying interest, while negative delta in the gap zone hints at selling pressure.
Confluence Zones:
Using Bookmap or Jigsaw Trading, the $10,743.95-$11,195.69 range is a liquidity hotspot. Tape reading and Sierra Chart data may reveal real-time order flow shifts.
Key levels: $11,195.69 (resistance) or $10,042.21 (support) based on Market Profile insights.
Trade Idea: Wait for confirmation (e.g., order flow reversal or CVD shift) before entering. The gap zone is a critical watch area today!

BNB/USDT Chart Analysis - June 27, 2025
Take a look at this 1H BNB/USDT Perpetual chart from Binance! The gap area (highlighted) between $646.23 and $648.68 is a key zone to monitor. Here’s the breakdown:
Gap Area Analysis: The $646.23-$648.68 range shows a potential consolidation zone. A break above $648.68 could push toward $659.46 resistance, while a drop below $646.23 might test $632.00 support.
Cumulative Volume Delta (CVD): Rising CVD supports the recent uptrend, indicating buying pressure. Watch for a slowdown as a possible reversal hint.
Liquidity Heatmaps & Order Blocks: The $648.68 level aligns with a liquidity heatmap peak, suggesting an order block. Expect a strong reaction—rejection or breakout.
Market Profile & POC: The Point of Control (POC) near $646.23 acts as a pivot. Value Area High/Low ($632.00-$648.68) defines the current value zone.
Low Volume Nodes (LVN): The $632.00-$636.00 LVN could serve as support or a breakout trigger if breached.
Order Flow & Tape Reading: Tape shows aggressive buying, with positive delta on the Delta Ladder, reinforcing bullish momentum.
Confluence Zones: The $648.68 resistance coincides with prior highs and a 50% retracement, making it a high-probability reversal or continuation point.
Trade Idea: Bulls target $659.46 if $648.68 holds. Bears watch for a fade below $646.23. Confirm with order flow and CVD!

ETH/USDT Chart Analysis (June 27, 2025)
Look at ETH/USDT perpetual futures chart! The gap area (shaded green) between ~$2,200 and ~$2,500 is a key zone to watch. Here's a breakdown with technical confluence:
Gap Area: This unfilled gap suggests potential support/resistance. Price action here could signal a reversal or continuation.
Cumulative Volume Delta (CVD): Rising CVD in this range may indicate buying pressure, while a drop could hint at selling.
Order Blocks: Look for institutional footprints—prior high-volume zones near $2,300-$2,400 could act as magnets.
Market Profile: The Value Area High ($2,431) and Low ($2,300) frame this gap, with the Point of Control (POC) around $2,260 acting as a pivot.
Low Volume Nodes (LVN): Thin volume areas above $2,500 might resist upward moves unless broken with conviction.
Liquidity Heatmaps & Order Flow: Expect liquidity grabs below $2,200 or above $2,500, with delta ladders showing aggressive buying at support levels.
Tape Reading: Watch for rapid order execution near $2,300—could indicate smart money stepping in.
Confluence zones align around $2,300-$2,400, where order blocks, POC, and gap support meet. Stay sharp—volume and delta shifts will confirm the next move!.