
Pi Network's long-term downtrend has persisted for a week, with its token value dropping nearly 16% against the backdrop of an overall market slump.
As macro uncertainties increase, and the daily token unlocks from the Pi plan continue to weigh heavily on market sentiment, the downward pressure appears far from over.
PI has broken below a critical threshold, with sellers in control.
Since reaching an all-time high of $3 on February 25, PI has recorded continuous weekly declines, with no significant demand inflow to halt the slide.
On the daily chart, the Moving Average Convergence Divergence (MACD) indicator reading for the token reflects a deepening bearish momentum. As of the time of writing, PI's MACD line (blue) is below the signal line (orange).
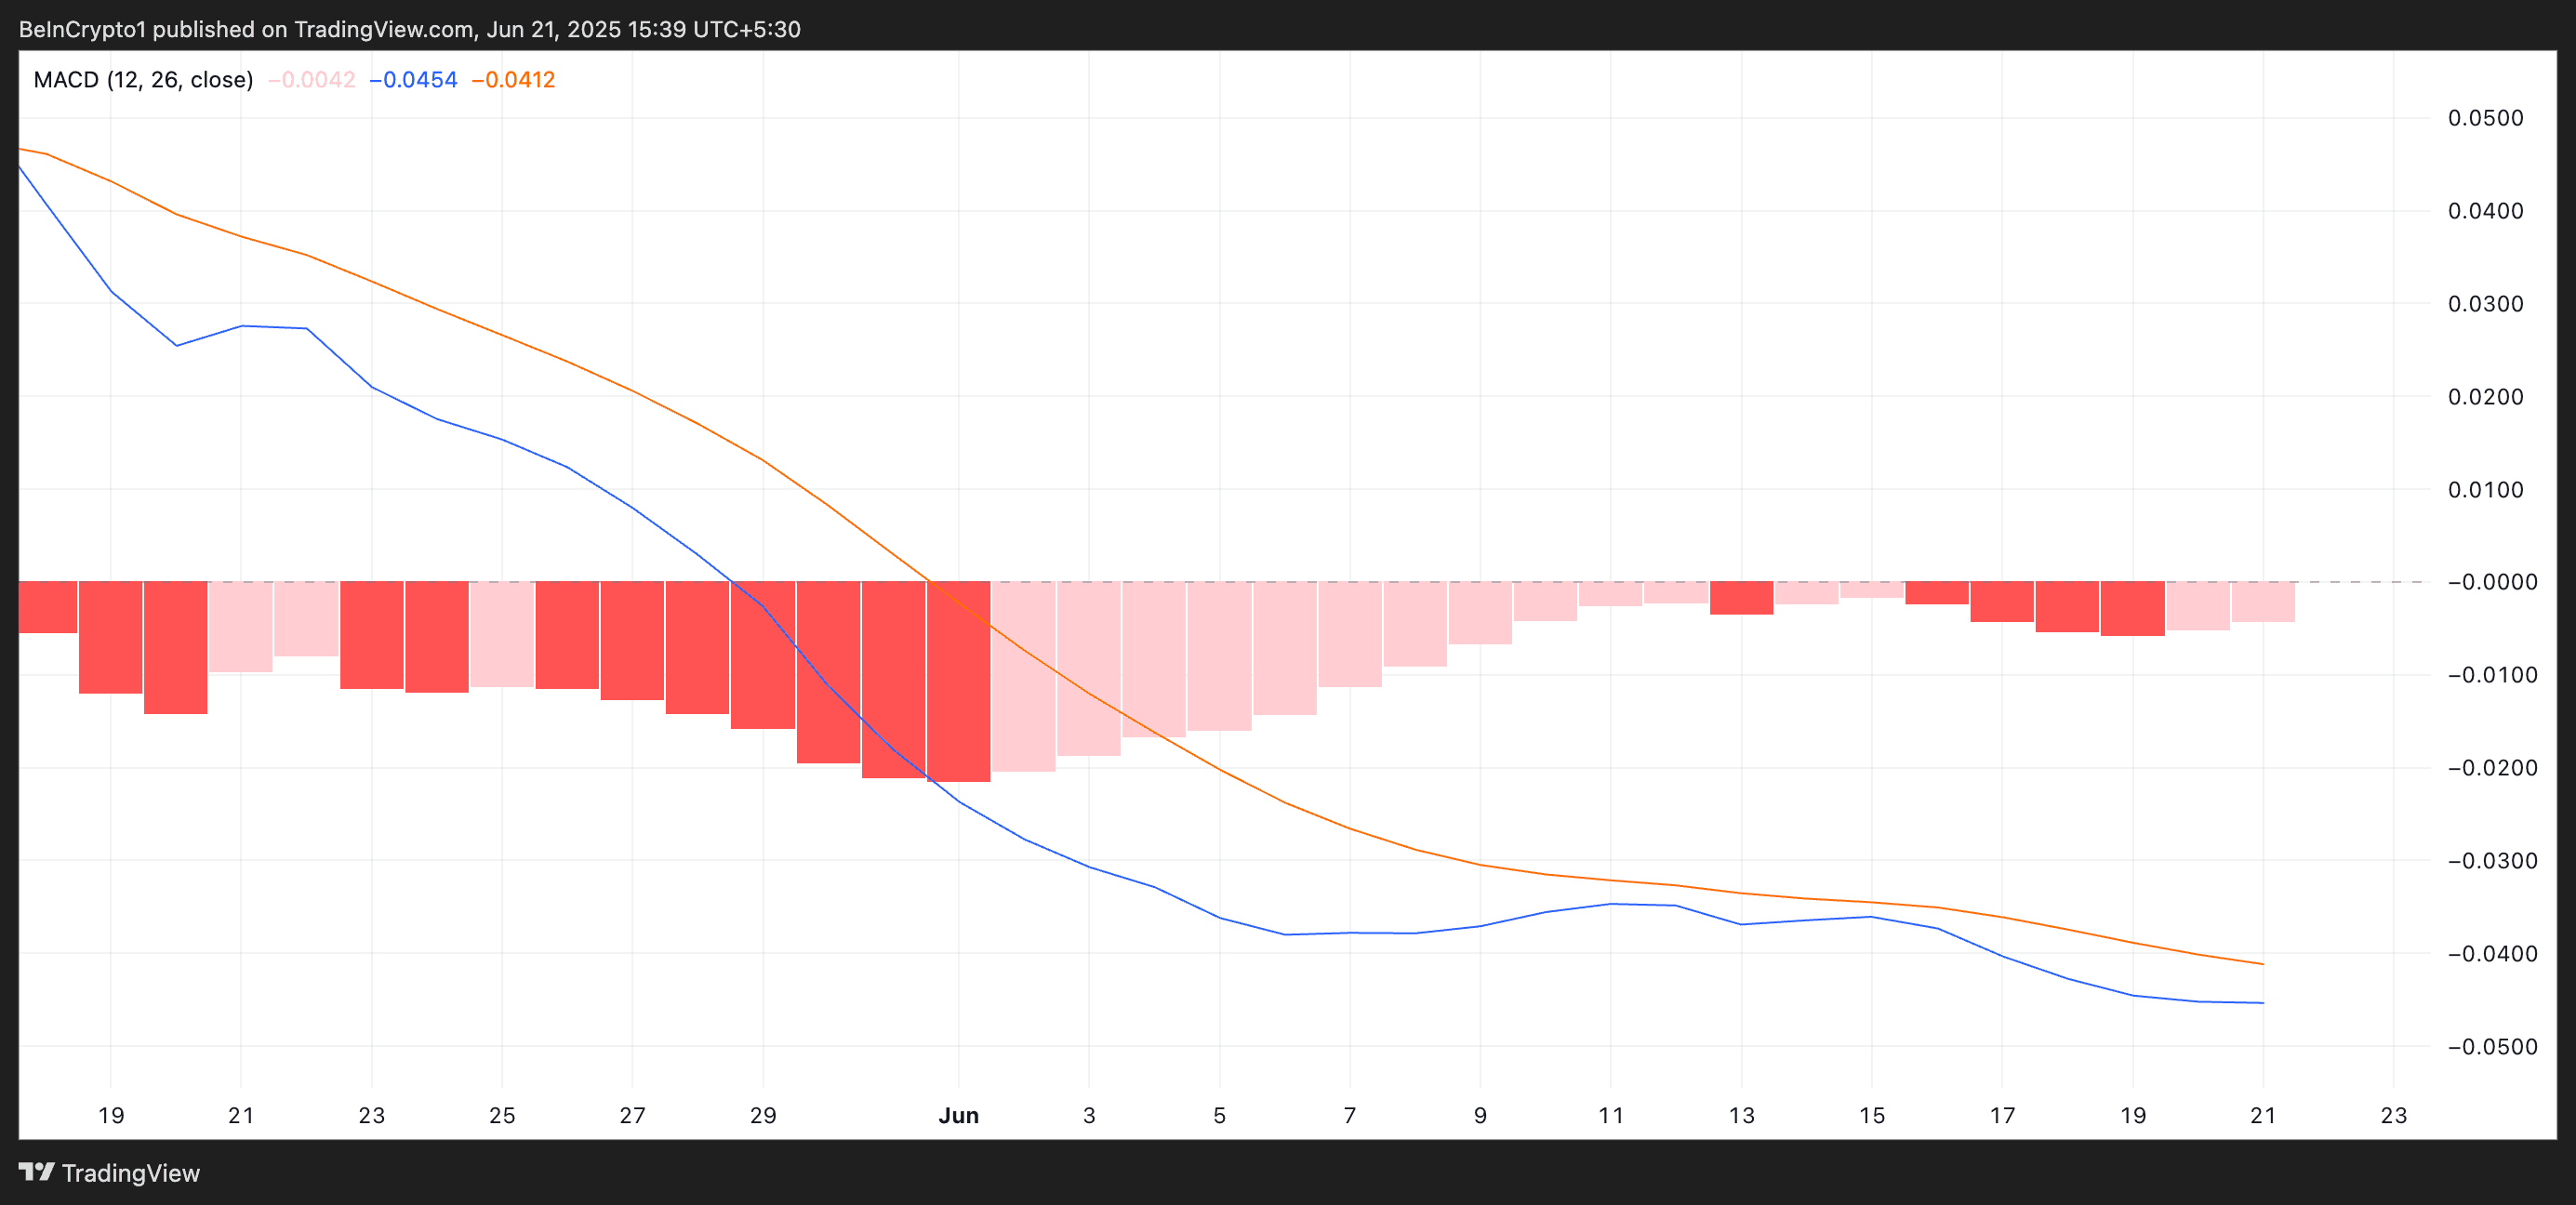
PI MACD. Source: TradingView
The MACD indicator is used to identify the trend and momentum of price movements. It can help traders discover potential buy or sell signals through the crossing of the MACD and signal lines.
Similar to PI, when the MACD line is below the signal line, it indicates that buying activity is weakening. Traders view this as a sell signal. Therefore, this could intensify the downward pressure on PI's price.
Moreover, PI's negative Balance of Power (BoP) indicates that sellers still firmly control the market. As of the time of writing, this indicator is -0.12.
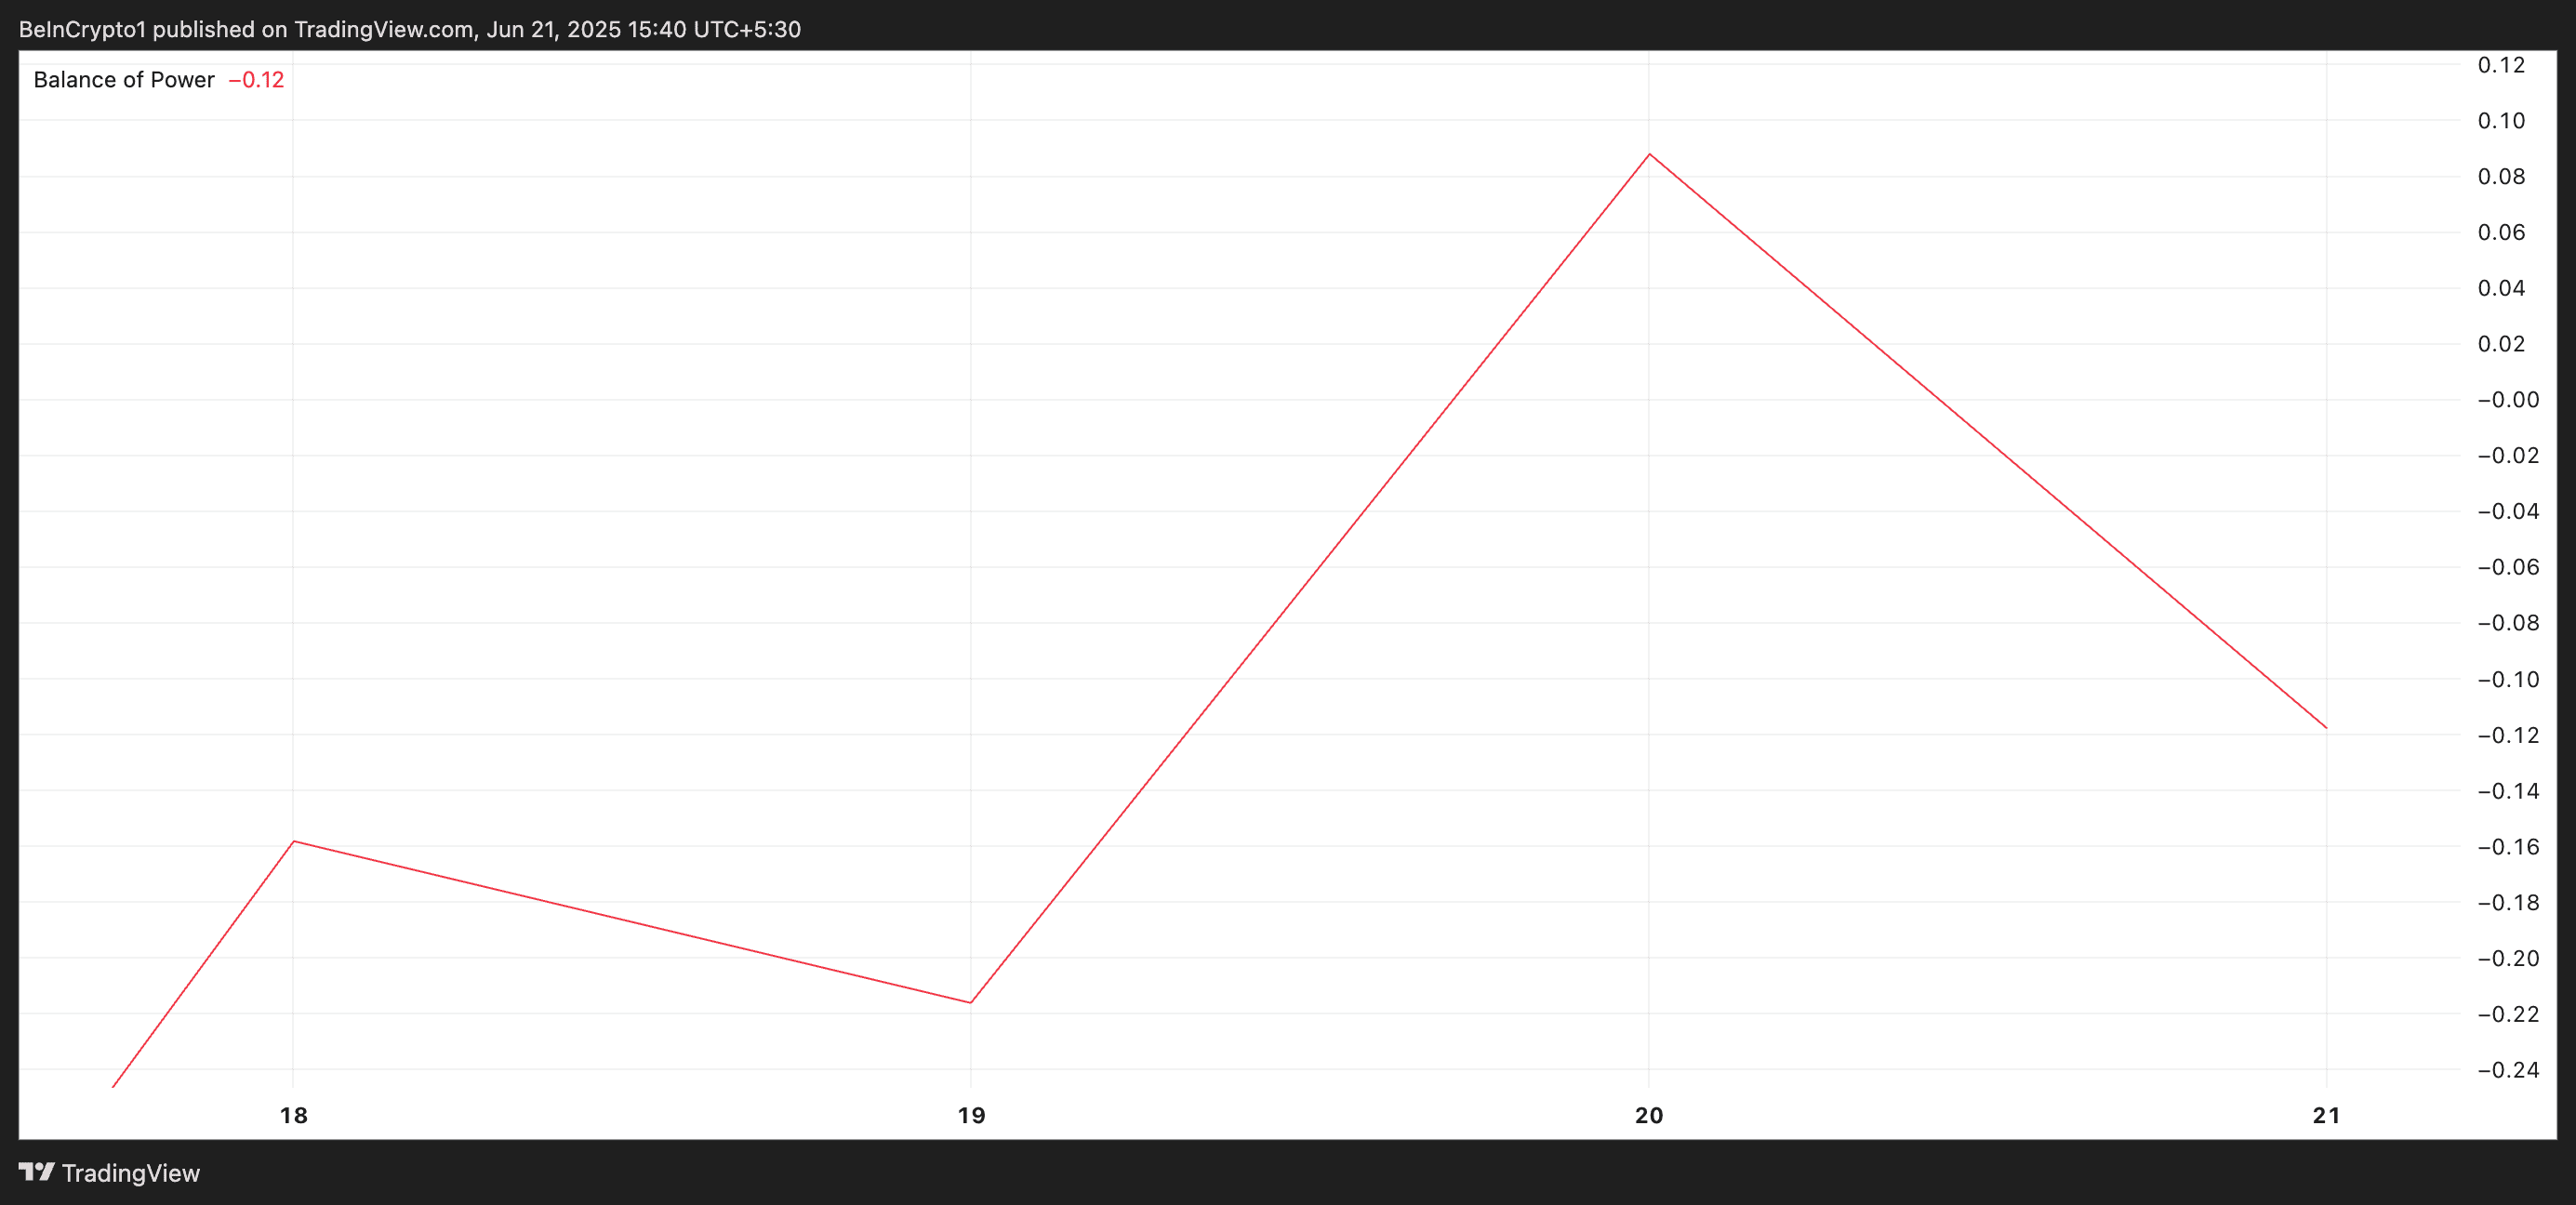
PI BoP. Source: TradingView
The BoP indicator measures the strength of buyers and sellers in the market, helping to identify momentum changes. When its value is positive, buyers dominate the market and drive prices up.
Conversely, the negative BoP reading indicates that sellers dominate the market, with buyers facing almost no resistance. This suggests that the market is under persistent downward pressure, and investor confidence is weakening.
For PI, the negative BoP reading reinforces the bearish outlook. This indicates that unless new demand emerges, the selling momentum may continue.
Pi Network struggles below the key EMA level.
Currently, PI's trading price is $0.53, below its 20-day Exponential Moving Average (EMA), which forms dynamic resistance at $0.56 above its price.
The 20-day moving average measures the average price of the asset over the past 20 trading days, giving more weight to recent prices. When the asset's price is below its 20-day moving average, it signals short-term bearish momentum and may continue to decline. If bears remain in control, this could push PI's price back to its historical low of $0.40.
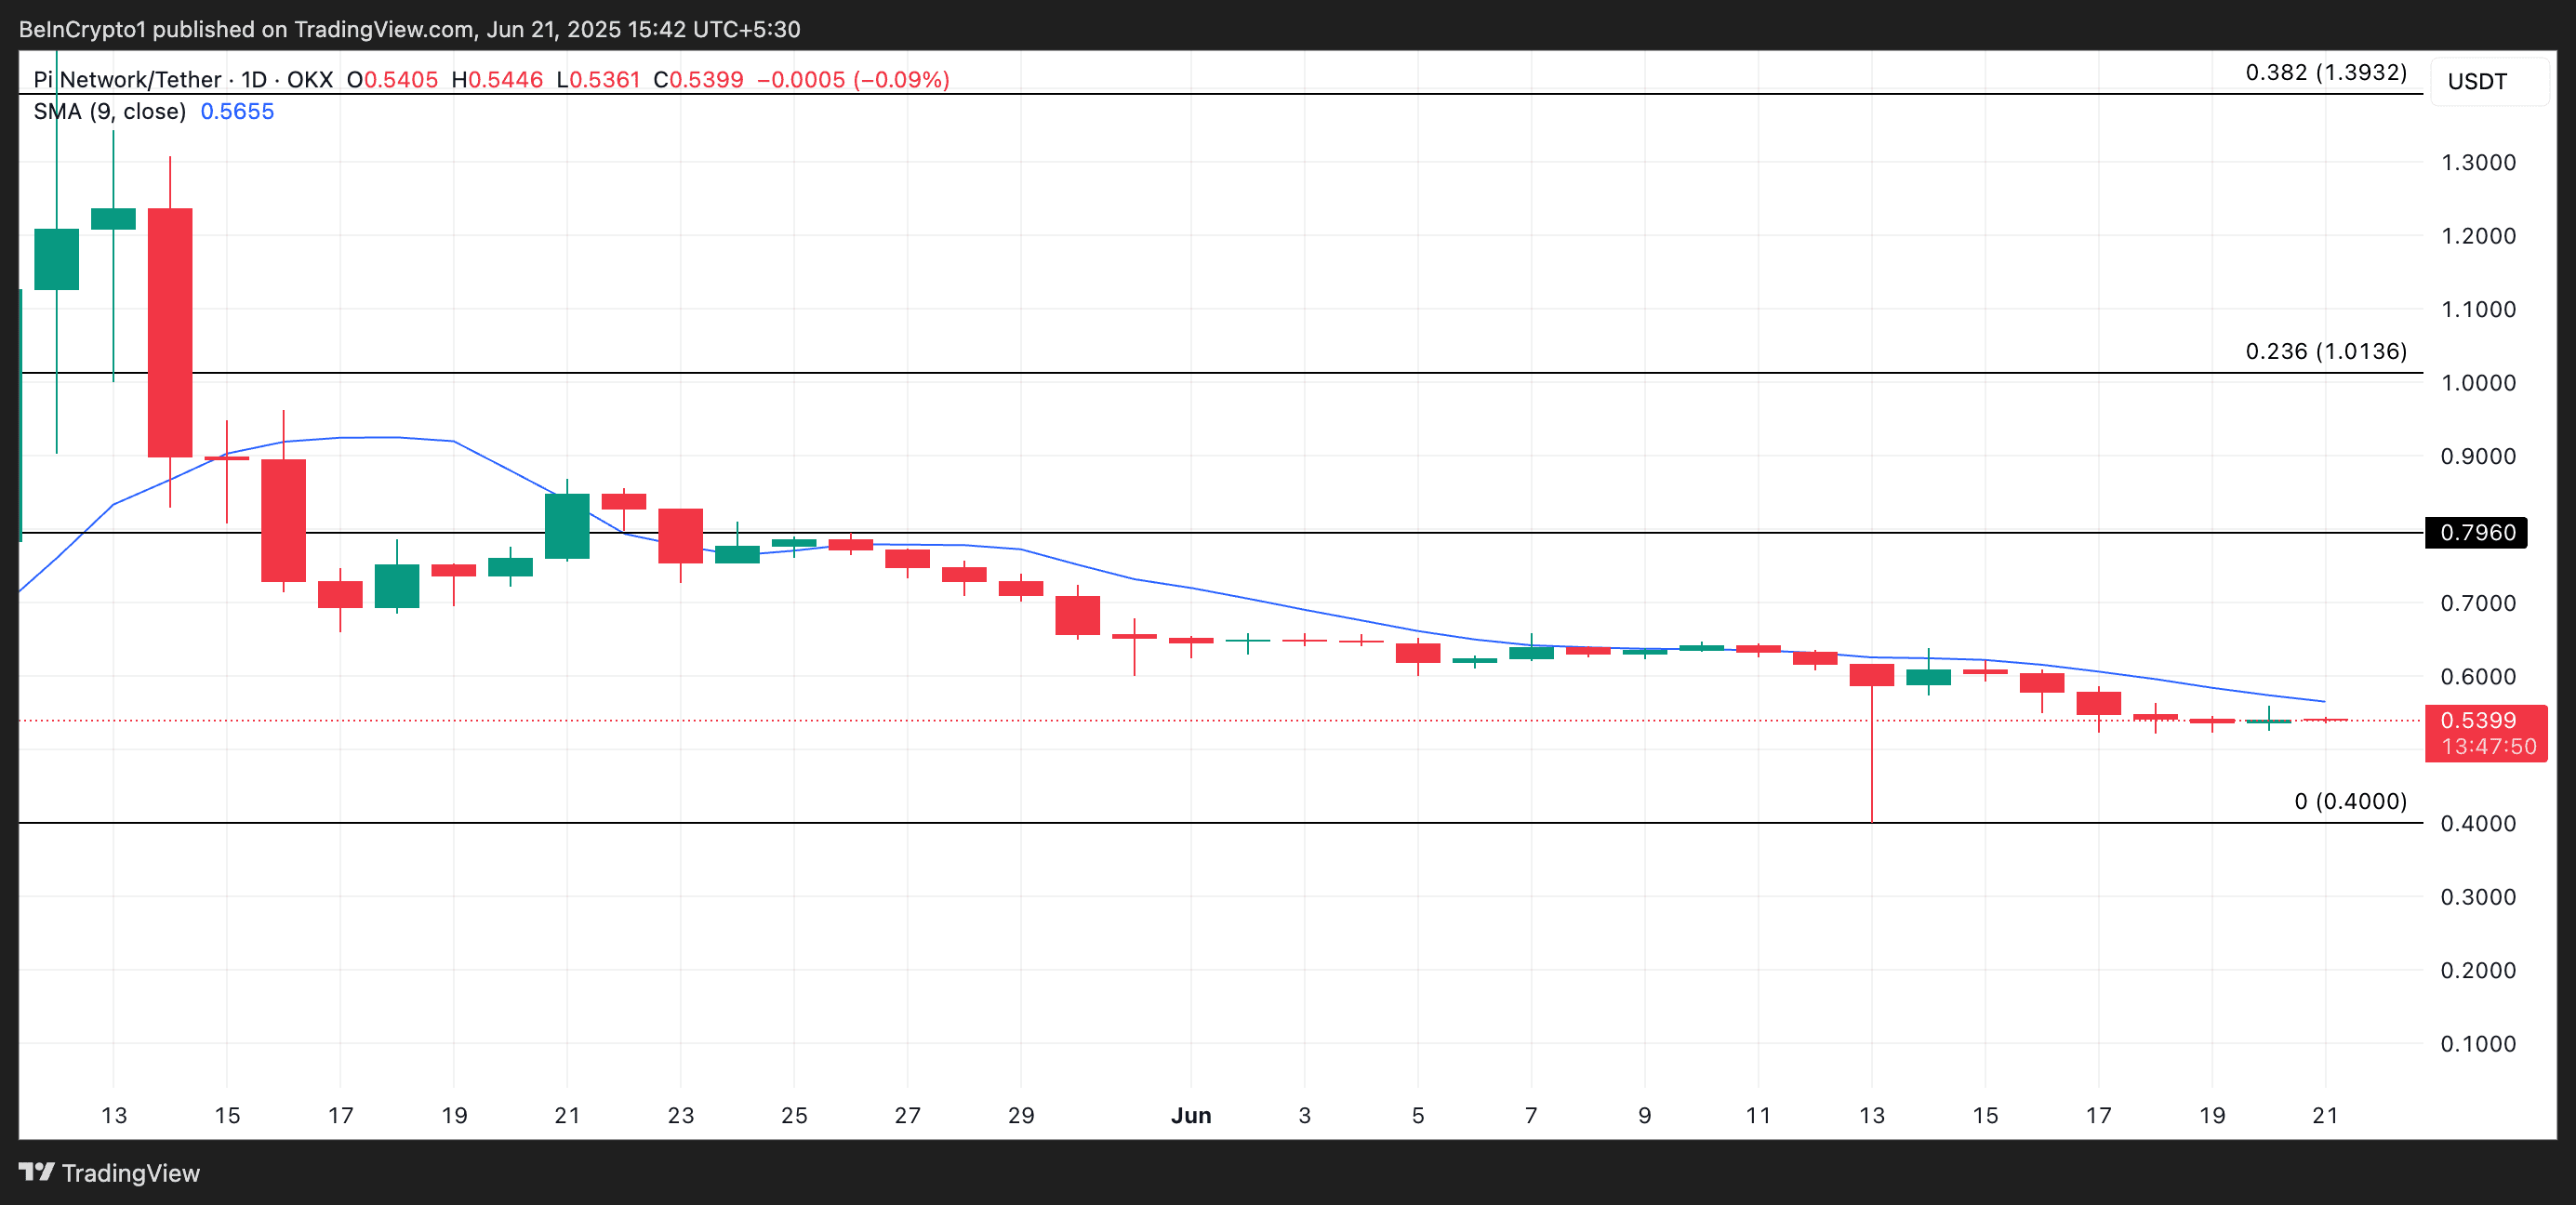
PI price analysis. Source: TradingView
However, a rebound could push Pi Network's token above the 20-day EMA and reach $0.79.
