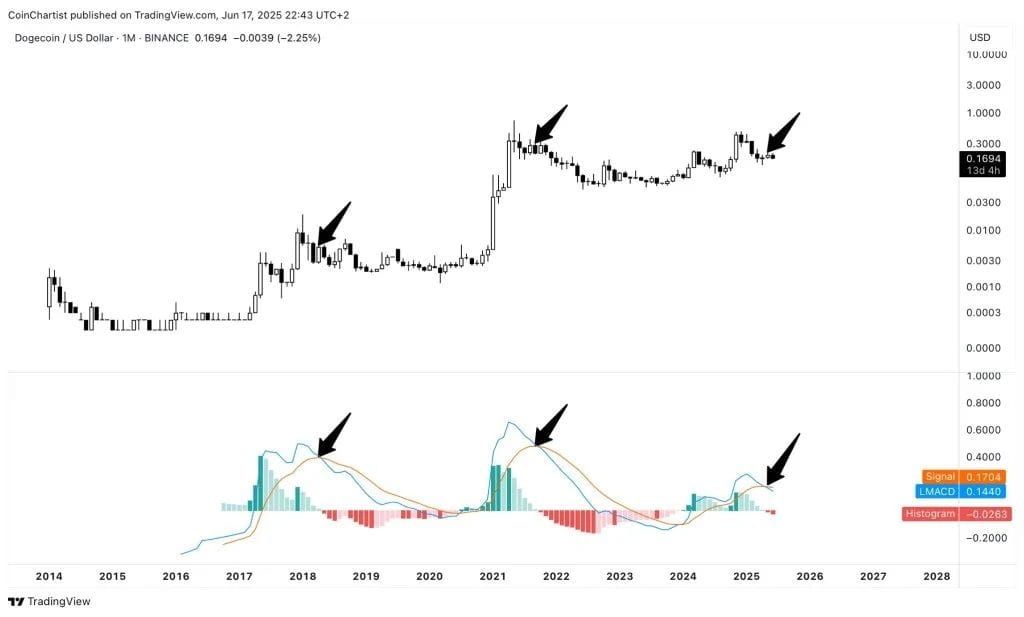
In the calm at the end of the cycle in mid-June, veteran market technician Tony 'Bull' Severino (CMT) released a monthly chart for Dogecoin (DOGE), suggesting that the vibrant roar of this meme coin may be gradually fading into a weak whimper. This 1-month candlestick chart was published on June 17, 2025, at 22:43 (UTC+2) on TradingView, setting Dogecoin's price at $0.1694—a drop of about 2.3% for the day—and drawing three prominent black arrows at the prior macro momentum peak, retreat, and eventual long-term decline.
Is Dogecoin just playing dead? Source: WeChat public account Feng Baobao roasting sweet potatoes
On the price panel, the first arrow points to the peak in January 2018, when Dogecoin (DOGE) briefly touched the 2-cent area before almost retracing all its gains. The second arrow marks the euphoric rebound in May 2021, when the token soared to just below 70 cents before beginning a two-year decline. The third arrow points to several recent lower monthly peaks, with last month's high reaching just below $0.26, after which it fell below the psychological barrier of 20 cents.
Dogecoin Price Analysis |
Below the candlestick chart, Severino overlays his preferred long-term MACD (marked as 'LMACD') with the default histogram. This indicator—blue representing the fast line, orange representing the signal line—records a rhythm akin to a metronome: sharp positive crossovers during parabolic rises, followed by equally steep bearish reversals as buyer fatigue sets in. The highest green bars of the histogram in early 2017 and early 2021 corresponded with these two price surges; after each time the histogram fell back to the neutral line and turned red, Dogecoin (DOGE) entered a multi-year downtrend.
Today, this pattern seems to be repeating. The blue LMACD line has just crossed below the orange signal line, with a histogram value of -0.0263, slightly negative, while the signal line is at 0.1704, and the LMACD itself is at 0.1440. This formation echoes the early phases of the 2018 and 2022 economic recessions, and Severino highlights these two previous reversal points with arrows. In his own words, the monthly oscillating indicator 'looks like it wants to roll over and play dead,' suggesting that this crossover may signal a deeper pullback towards historical support levels.
Structurally, Dogecoin is currently positioned between the bottom of the previous cycle (near the 5-cent mark) and the upper resistance level (around the volatility peak of $0.48 at the end of 2022). The weakening momentum indicated by the LMACD suggests that unless new demand emerges to offset the initial bearish crossover, the bears will remain in control. If Dogecoin ultimately closes below the April low of around $0.13, it will enter a vacuum-like area, potentially touching the cycle bottom of $0.0491.
Severino's analysis, while technically rigorous, comes at a moment of widespread decline in cryptocurrency liquidity before the summer slump, and as hopes for the Fed's next rate cut are delayed, along with signs of softening risk appetite for digital assets amid geopolitical tensions between Israel and Iran.
For long-term traders, momentum matters more than memes, so the monthly crossover carries more weight than any hot tweet. History may not repeat itself exactly, but for Dogecoin holders, every time the LMACD pulls back from a high, it does so with unsettling precision.
Whether this dog-themed currency is truly curling up to take another nap or merely pausing before a new round of tail-wagging speculation will depend on how prices respond as the histogram continues to decline in the coming months. Currently, the message conveyed by this chart is unmistakable: the dominant trend of Dogecoin has lost its pulse, and momentum traders may need to closely monitor this dog's breathing rather than concluding it is just playing around.
As of the time of writing, DOGE is trading at $0.168.
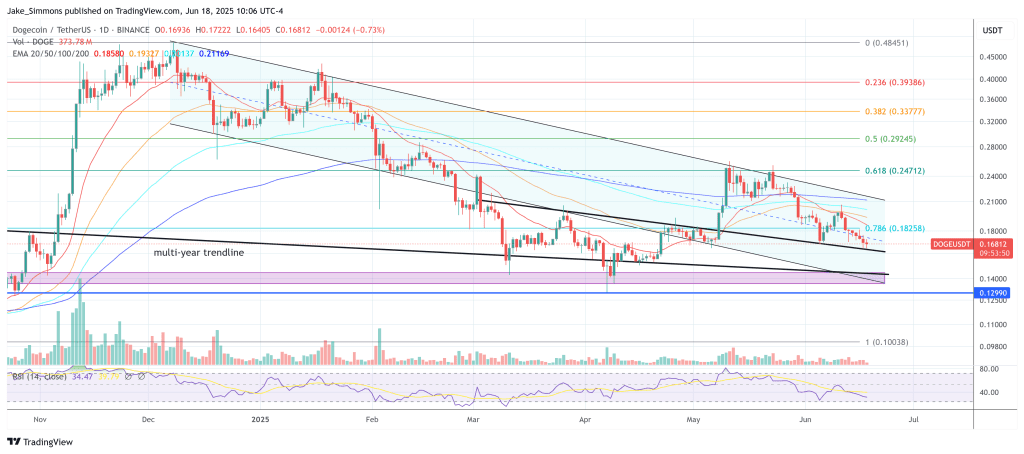
DOGE hovers above key support levels, 1-day chart | Source: DOGEUSDT on TradingView.com
