Bitcoin's 'golden cross' lights up again! Could this wave be a signal for an upward trend?
Recently on X (formerly Twitter), CryptoQuant's analyst Darkfrost published an article discussing something that sounds very impressive: Bitcoin's NVT golden cross.
Don't panic, it's actually not complicated.
What is NVT? Simply put, it is Bitcoin's 'market cap ÷ on-chain trading volume'. Imagine: if Bitcoin's market cap is very large but no one is willing to trade it, it means it has 'value but no market', like a bottle of water priced at 10,000 yuan but no one buys it. NVT uses this logic to judge whether the market has overvalued Bitcoin or if it really is worth that much.
So what is the 'golden cross'? This is based on the NVT indicator with a bit of technical analysis added: using the crossover of short-term and long-term moving averages to judge trend changes. When the short-term line crosses above the long-term line, it usually indicates improved market sentiment, a bullish signal!
Now, this 'golden cross' has broken through to 2.2—this value may not sound large, but historically, every time it breaks this level, Bitcoin tends to get restless, either soaring or causing a stir.
Although we cannot be 100% sure that this will definitely mark the beginning of a bull market, at least we can say: the market is showing some small movements, and smart money may be secretly entering the market.
Should I buy Bitcoin? Just look at this indicator!
We all know that Bitcoin's price has always fluctuated, when is really the opportunity to buy? When is it the rhythm of an impending 'bubble burst'? Now, there is an indicator called the NVT golden cross that can help you sort through this issue.
Don't be scared by the name, it's actually quite down to earth.
In simple terms, this indicator compares Bitcoin's current 'value' (which is the market cap) with its 'activity' (on-chain trading volume). Imagine a coin with a shocking value, but no one is trading or touching it, that could likely signal an overvalued price and an impending bubble; conversely, if the trading volume of a coin is very high but the price hasn't risen much, it may not have been 'discovered' by the market yet—put simply, there's still room for growth.
This is the basic NVT ratio.
The 'NVT golden cross' is an upgraded version of it, similar to adding 'Bollinger Bands' + 'moving average system' to this indicator to determine high and low points.
How is it specifically judged? It's quite simple:
It looks at two lines: one is the short-term trend (10-day average), and the other is the long-term trend (30-day average);
When the short-term line crosses above the long-term line—meaning the short-term trend has risen, this usually indicates that 'the market is starting to heat up', presenting an opportunity;
On the contrary, if the short-term line crosses below the long-term line, it indicates that market sentiment is turning cold, so be careful.
Now, the value of this golden cross indicator has broken through 2.2, which is the starting point for many significant market movements in history. Although it cannot be said that the 'rise is crazy' is set in stone, smart money has already set its sights on it.
Below is a chart shared by the analyst, showing the trend of this indicator over the past few years.
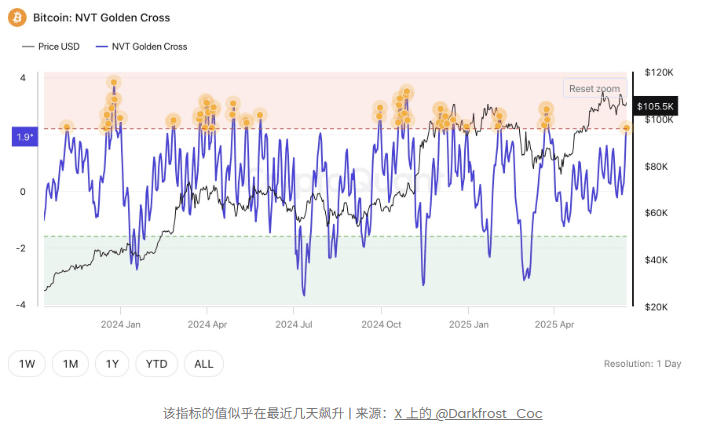
NVT golden cross soaring to 2.2+, is Bitcoin getting a bit floaty?
Let's talk with images (pretend you've already seen the chart👀), Bitcoin's NVT golden cross recently broke through the '2.2 barrier', officially entering the red warning zone—it's as if the price is saying: 'Bro, I'm a bit overvalued, take it easy'.
What does this mean? Let's speak plainly:
The NVT indicator is originally used to measure the relationship between 'market cap' and 'on-chain trading volume', simply put:
💰 A lot of money (high market cap)
🧍♂️ But no one is using it (low trading volume)
👉 Then this coin might be overvalued.
Now that the golden cross has broken 2.2, it means the market cap has far exceeded the trading enthusiasm. In other words, this market surge is a bit too strong, like a worker who has had five cups of coffee, sooner or later they will need to take a break.
At such times, history tells us that there is a high probability of a 'mean reversion'—that is, the price has gone too far, and the market will pull it back for a healthy adjustment (commonly known as a 'pullback' or 'little calm' 😅).
The golden cross has issued a 'warning', but it doesn't mean it will immediately plunge!
Don't panic, although the NVT golden cross indicator has now lit up a red light🚨, looking at historical charts, it doesn't always appear exactly at price peaks. Sometimes, when this signal comes out, the coin price can continue to surge for a while; even if it starts to fall, the extent is usually not too alarming.
However, this time is a bit special. Since this signal appeared, Bitcoin has indeed started to slide down📉. Although it can't yet be called a 'crash', this trend is indeed making people a bit anxious.
So should we be worried now?
It's still hard to say—
🤏 It may just be a 'gentle adjustment', with a slight correction before it surges again;
😬 It may also enter a 'continuous correction mode', with a steady decline making people emo.
The market hasn't shown a clear direction yet, so don't easily go all in. In crypto jargon, it means:
'The signal is a bit gloomy, don't push too hard in the market, watch the wind direction before deciding whether to get on board.'
Bitcoin price
At the time of writing, Bitcoin's price hovers around $103,700, having dropped nearly 5% in the past seven days.

