$BTC Bitcoin is trading at $105,814, with a market cap of $2.104 trillion and a 24-hour trading volume reaching $34.134 billion. The daily price range between $105,871 and $108,785 reflects a contained yet active market, indicating a continuous state of indecision among traders.
Bitcoin
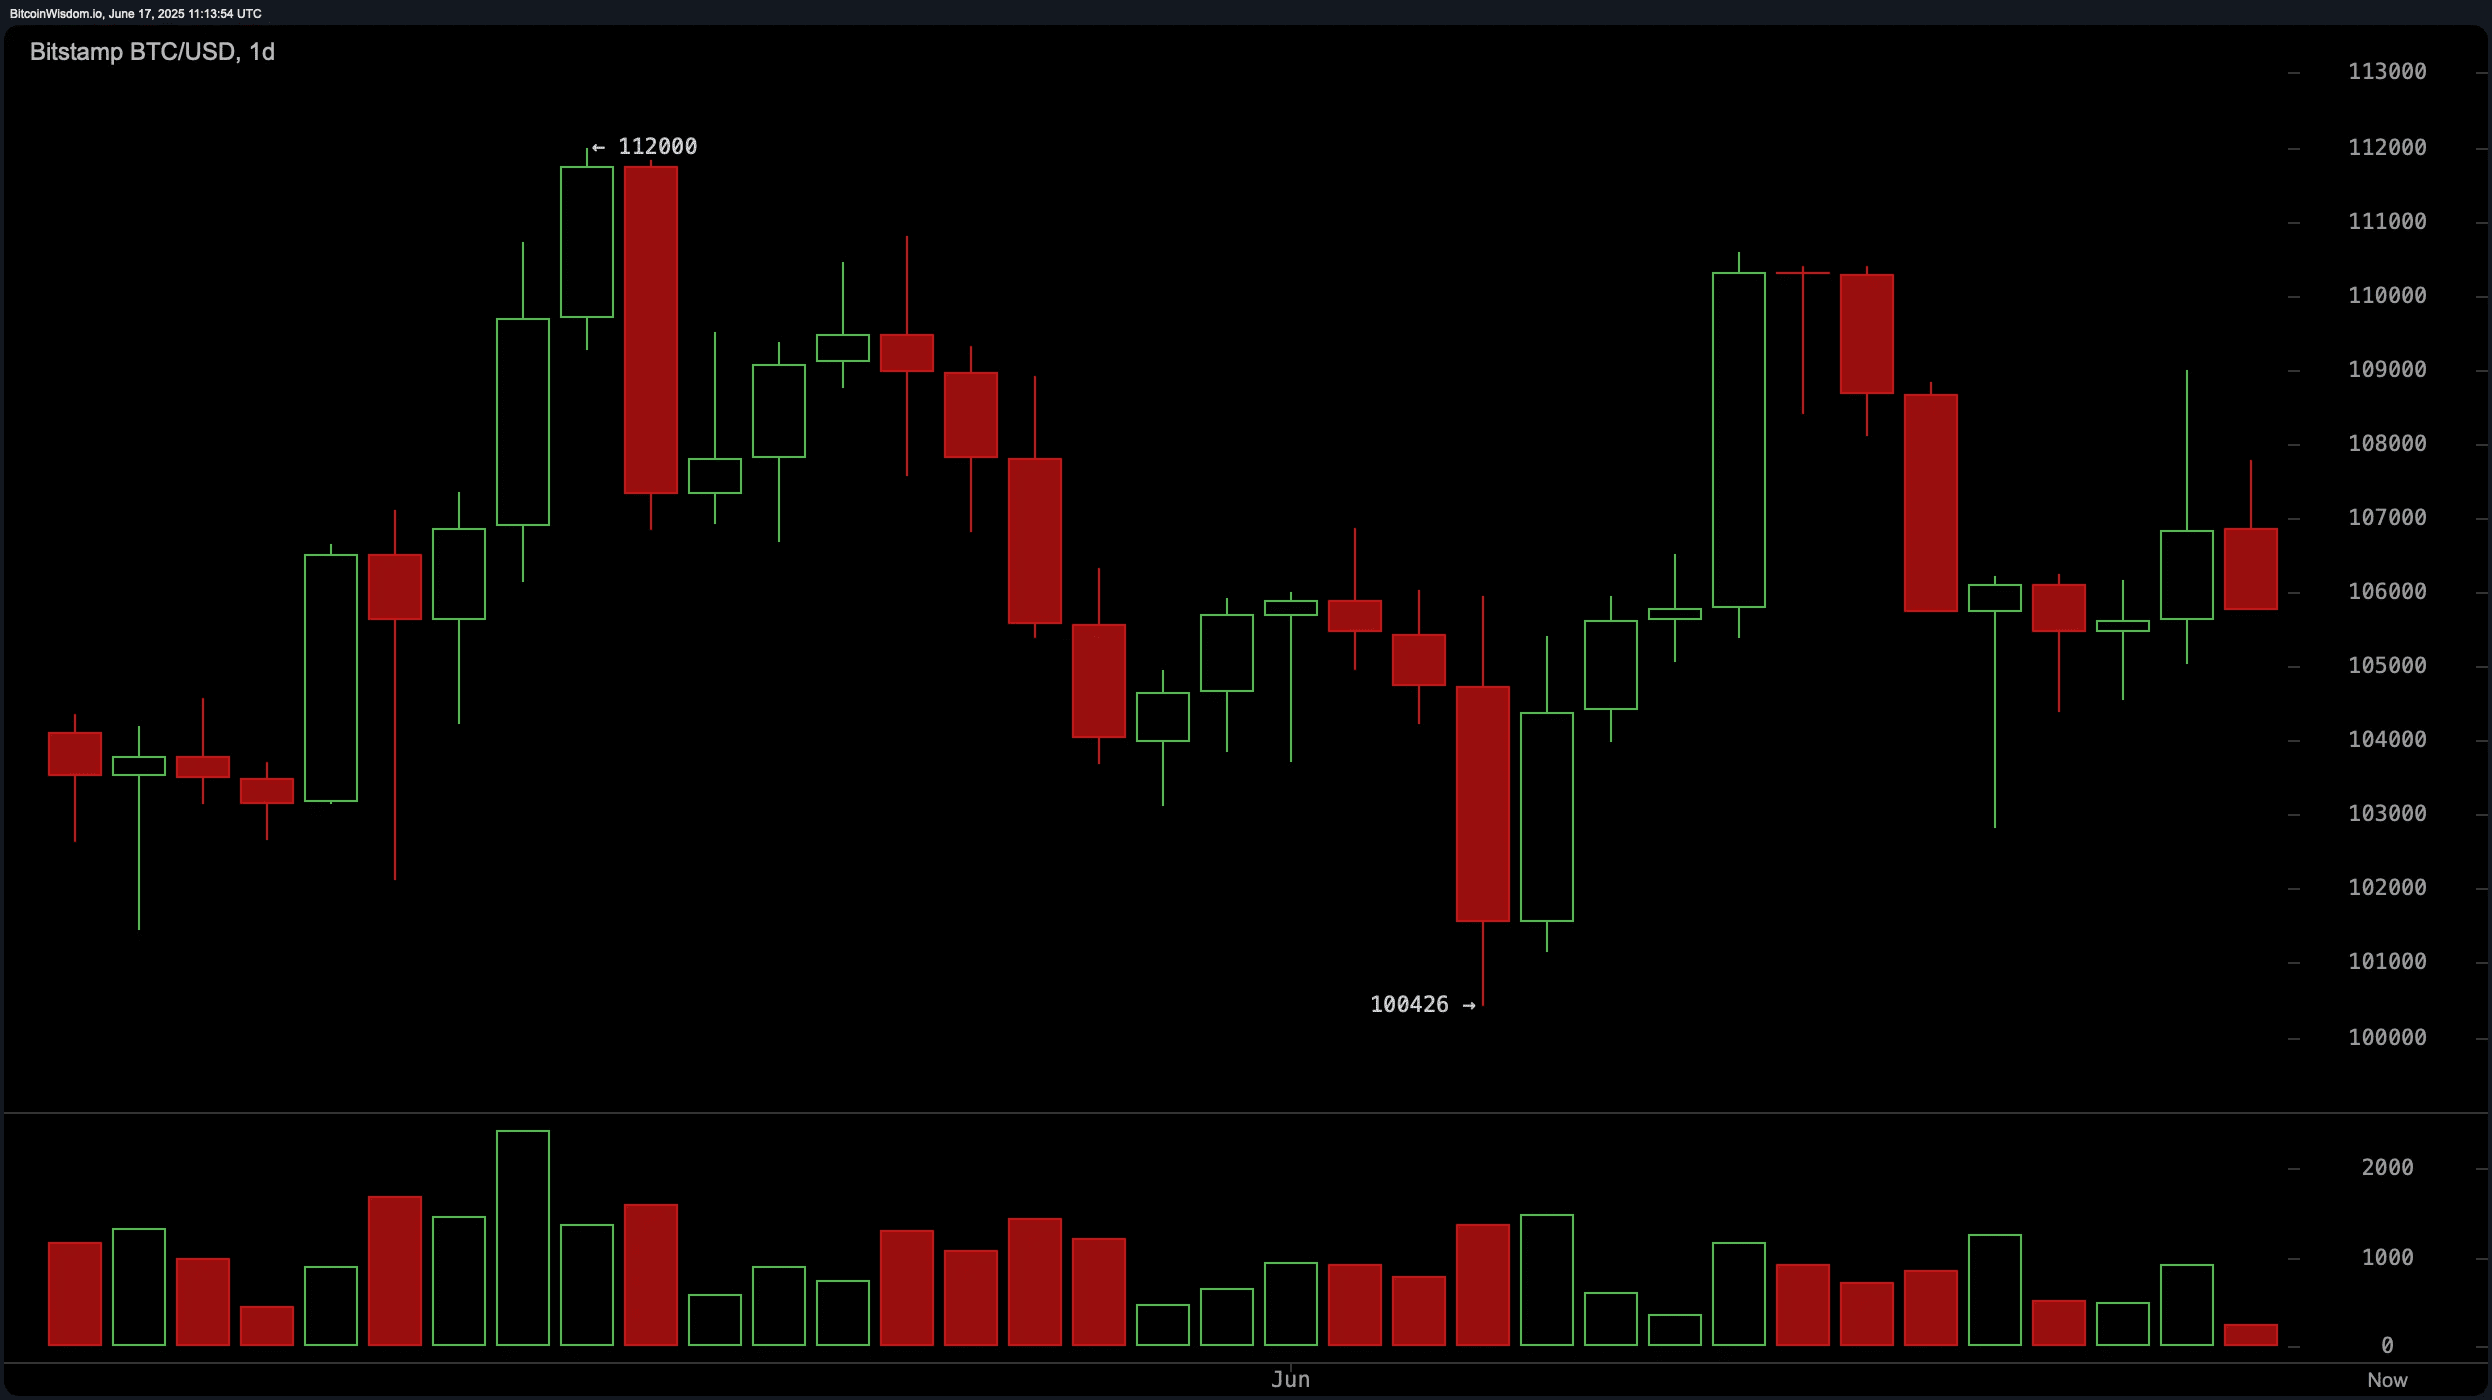
The daily chart for Bitcoin reveals a bearish tone. After reaching a peak of $112,000, a significant rejection occurred, characterized by a sharp red candle and a shift towards lower highs. There appears to be strong defense from buyers near $100,426, forming a key support level. On the other hand, the resistance range between $110,000 and $112,000 has repeatedly rebuffed upward movements. The increase in trading volume during sell-offs is associated with distribution, indicating that major players are offloading their positions.
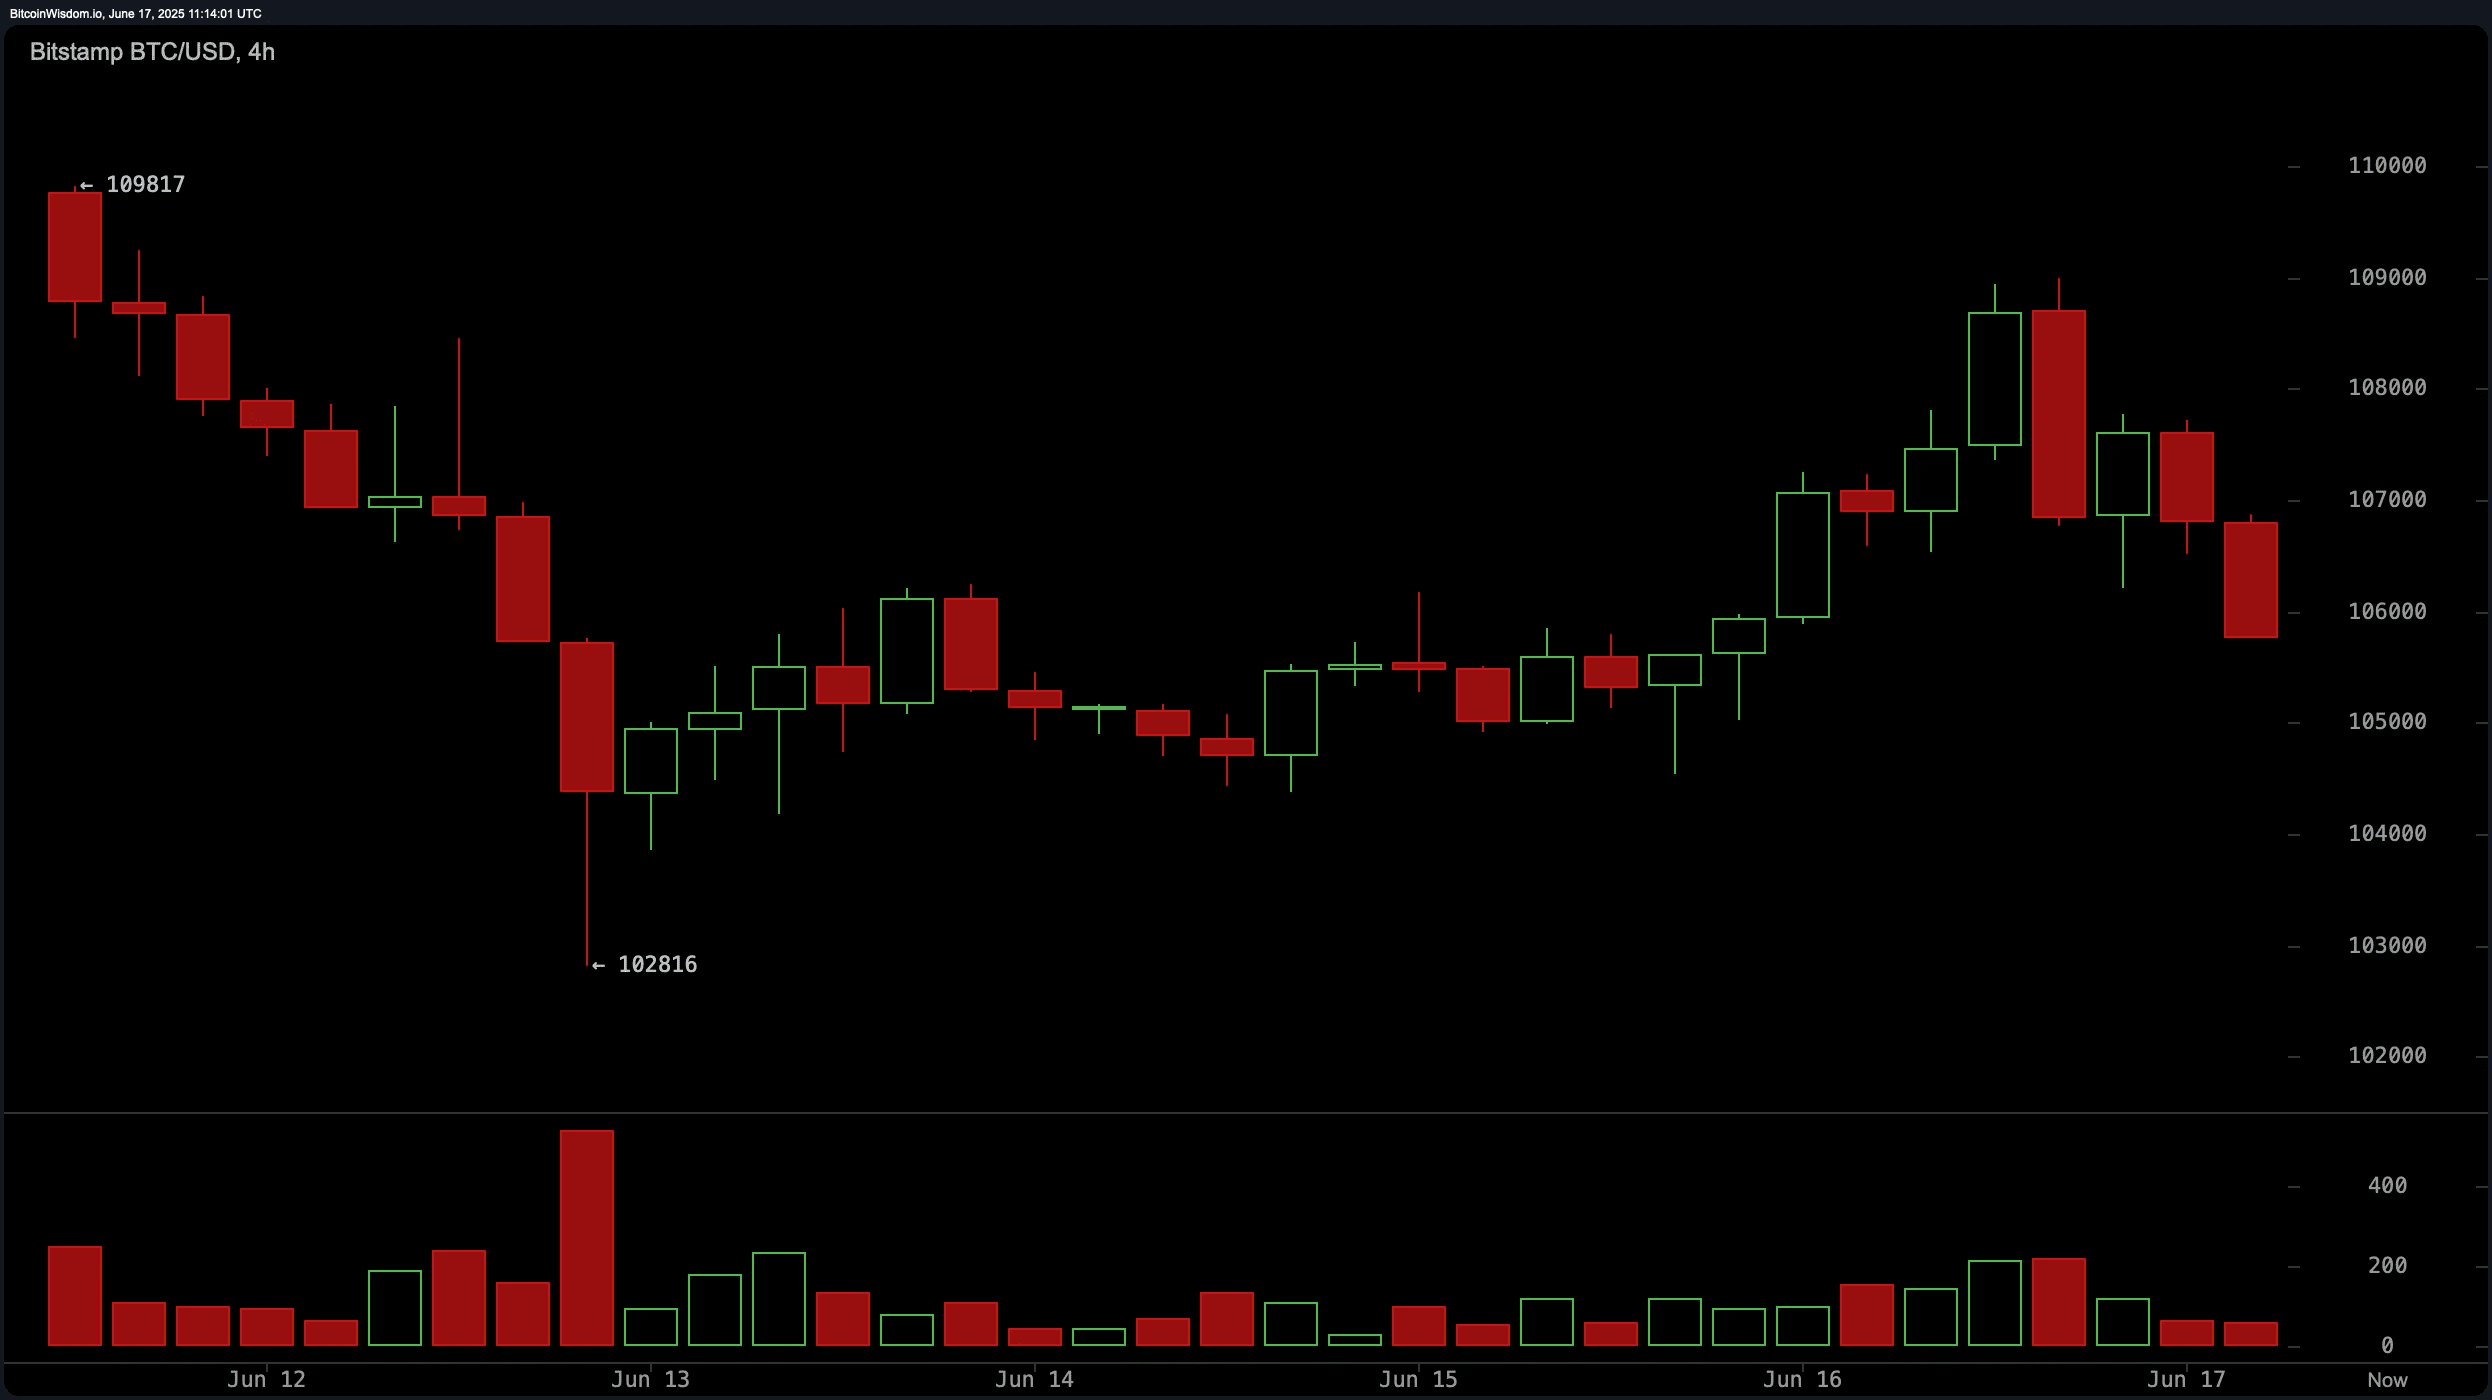
The 4-hour chart shows a weaker bullish structure turning towards a bearish trend. Bitcoin recently bounced off $102,816 but failed to maintain momentum above $109,000. Lower high formations are evident, signaling weakening bullish strength. Bearish trading volume near local highs supports the distribution view. If Bitcoin prints a double bottom or bullish divergence between $103,000–$104,000, an upward opportunity may arise. On the other hand, rejection near $108,500–$109,000 will confirm selling pressure.