Bitcoin (BTC), Ethereum (ETH), and Ripple (XRP) are gradually regaining stability after a strong correction last week, as the prices of all three cryptocurrencies are currently hovering around important technical support levels. Bitcoin is attempting to regain upward momentum after closing below the important support level, while Ethereum and Ripple remain hesitant at key technical levels – positions that could shape the market's next direction.
Bitcoin could drop significantly if it closes below the 50-day EMA.
Bitcoin closed the trading session on Thursday below the important support level of $106,406, before bouncing back after touching the 50-day exponential moving average (EMA) at $102,893 the next day. Throughout the weekend, the largest cryptocurrency maintained a sideways state around the $105,000 area. As of now (Monday), BTC is still accumulating around the $106,000 mark – indicating that market sentiment remains quite cautious.
If Bitcoin cannot close above the $106,406 resistance area and continues to weaken, the downtrend could reoccur, pulling the price down to retest the key psychological level of $100,000.

On the daily timeframe, the RSI indicator is hovering around the neutral level of 50 – reflecting the tug-of-war between bulls and bears. At the same time, the MACD has just shown a bearish crossover, issuing a clear sell signal and reinforcing the likelihood of a downtrend forming in the short term.
However, if the buying force is strong enough to push the price above the $106,406 mark, a recovery trend may be triggered, opening up opportunities to retest the next resistance area.
Ethereum may enter a downtrend if it breaks below the 50-day EMA.
Ethereum (ETH) lost the important support level of $2,724 on Thursday, leading to a decline of 8.69% as of Saturday. However, selling pressure temporarily halted as ETH maintained the lower boundary of the accumulation channel around the $2,461 mark the next day. As of Monday, this cryptocurrency still holds above the aforementioned price area, indicating a certain defensive effort from the bulls.
However, if selling pressure continues to increase and causes ETH to close below the 50-day exponential moving average (EMA) at $2,429, the downtrend could be extended, with the next target being the strong support area around the $2,000 mark.

On the daily timeframe, the RSI indicator is hovering around the neutral level of 50, reflecting the market's indecisiveness in the context of a lack of clear momentum. Simultaneously, the MACD has formed a bearish crossover – a negative signal indicating that selling pressure is prevailing.
However, if ETH continues to maintain above the $2,461 threshold and regains upward momentum, the $2,724 resistance area may be the next target, marking a recovery of the short-term uptrend.
XRP faces the risk of decline if it cannot hold the 50-day EMA.
XRP closed below the 50-day exponential moving average (EMA) at the $2.24 mark on Thursday, marking a nearly 6% decline as of Saturday. However, the next day, the coin slightly recovered by 1.22%, indicating an effort to regain upward momentum. As of the time of writing, XRP is nearing the 50-day EMA at $2.24 – a key price level that could shape the next trend.
If rejected at the 50-day EMA, XRP is likely to extend its downtrend to retest the important support area at $1.96.
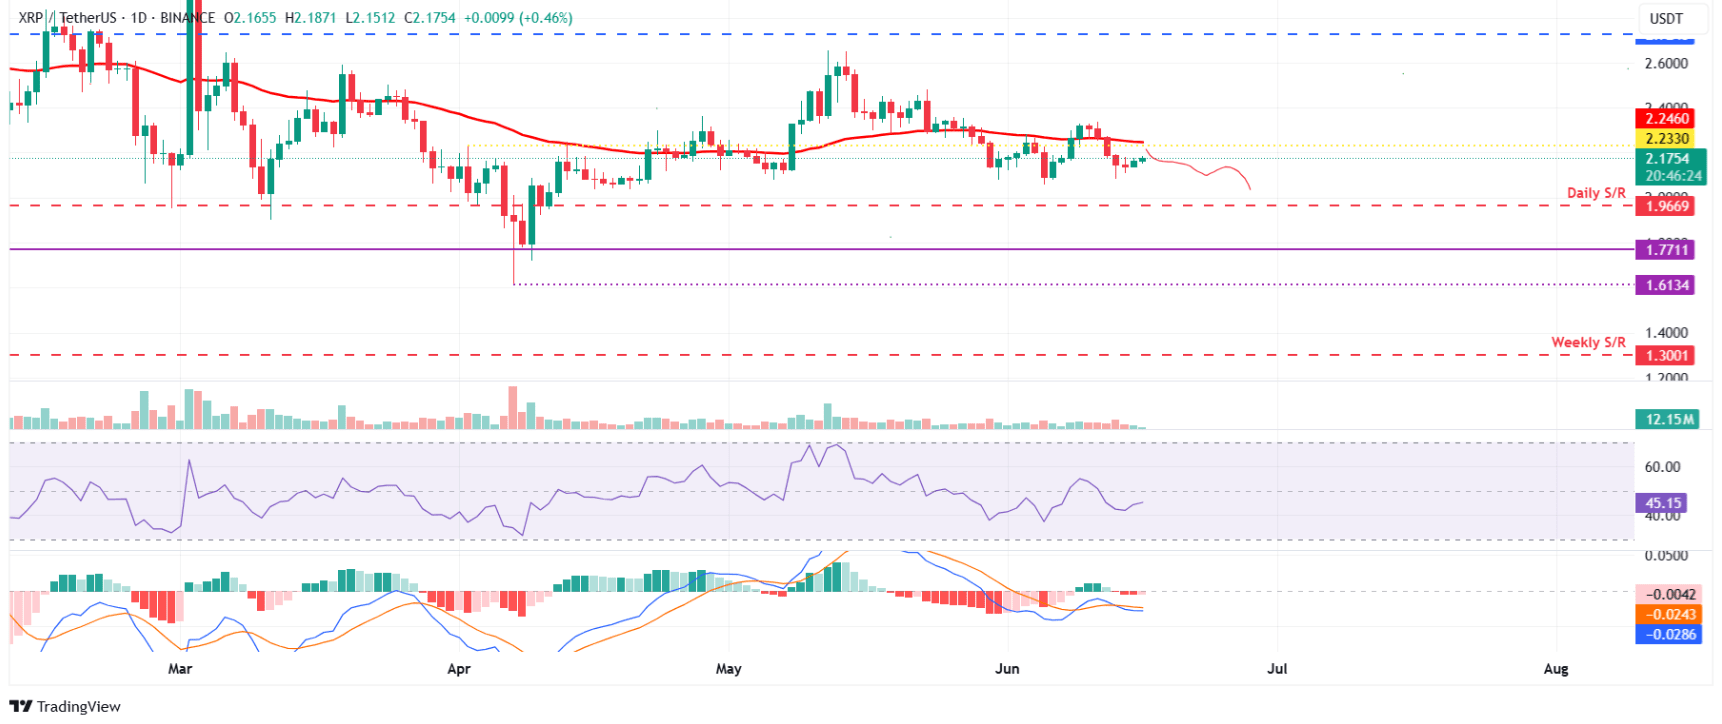
The RSI indicator on the daily timeframe is currently at 45, below the neutral threshold and continuing a downward trend – a sign that selling pressure remains dominant. At the same time, the MACD has shown a bearish crossover, issuing a clear sell signal and reinforcing the negative outlook for XRP in the short term.
Conversely, if XRP successfully breaks above the 50-day EMA, the coin could open up opportunities for recovery and retest the $2.25 mark in the upcoming sessions.
