What is grid trading?
A grid is a type of quantitative trading strategy. Moreover, it is a simple and relatively mechanical one.
It defines a price range, setting a batch of buy prices and a batch of sell prices. Like a fishing net, whatever it catches counts.
Specific gameplay of grid trading strategy
Parameters of grid trading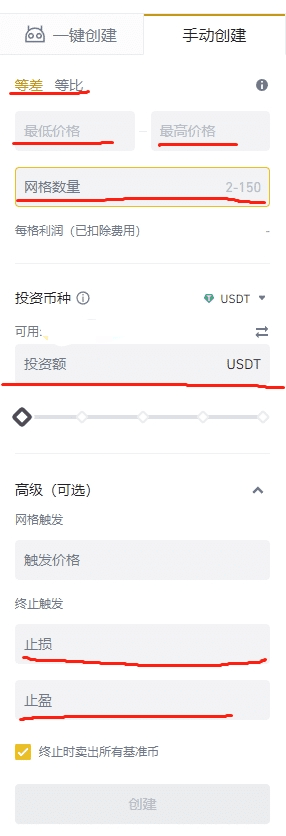
Binance's grid trading feature
1. Lowest price and highest price: This means your grid range.
2. Number of grids: This means how many price points you want to set within this range.
5 trades mean a total of 5 buy and sell transactions; 100 trades mean a total of 10 transactions. More transactions mean smaller single transactions; fewer transactions mean larger single transactions.
Generally, the difference is not significant, depending on personal preference. 300-500 dollars is appropriate.
3. Price setting methods: Divided into arithmetic grids and geometric grids.
An arithmetic grid means the price difference of the grids is the same. For example, setting prices at 100, 200, 300, and 400 results in equal price differences of 100.
A geometric grid means the price ratios of the grids are the same. For example, setting prices at 1, 1.1, 1.21, and 1.331 means the price differences are in the same ratio, all at 1.1 times.
Once you know the grid range, the number of grids, and the price difference method, you can calculate the price for each grid.
In an arithmetic grid, price difference = (highest price - lowest price) / number of grids; grid price_1 = the lowest price of the grid, and above that, add the price difference each time.
In a geometric grid, the price percentage = ((highest price - lowest price) ^ (1/number of grids) - 1) * 100%, grid price_1 = the lowest price of the grid, and above that, multiply by the price difference each time.
Actually, you generally don't need to calculate this; the system will calculate it for you. Moreover, this difference is not significant, depending on personal preference.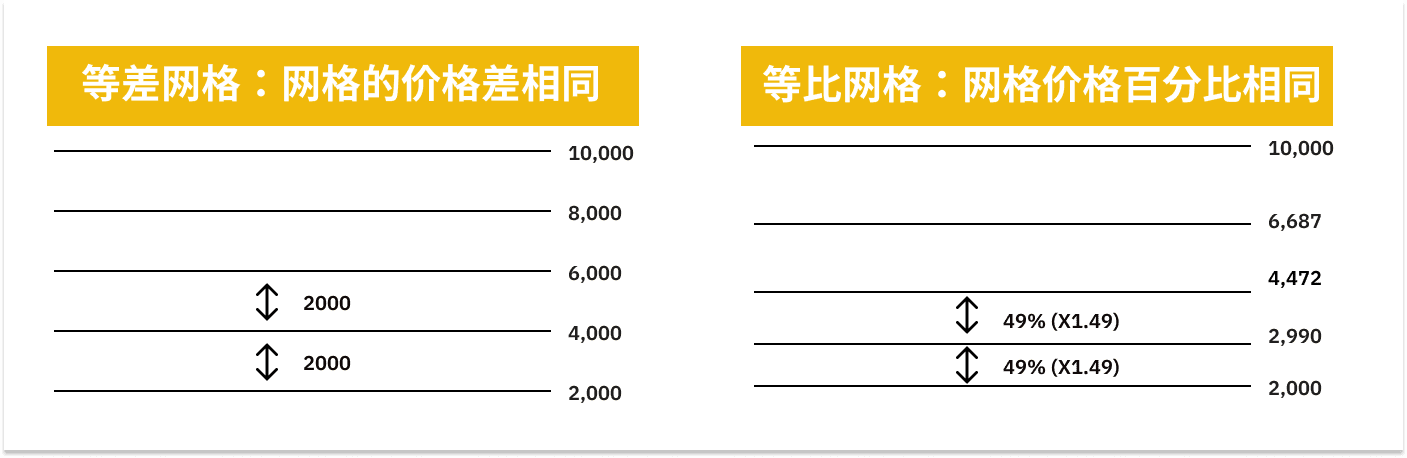
In an arithmetic grid, the price differences are the same; in a geometric grid, the price percentages are the same.
4. Investment amount: This is the total amount you are willing to invest in this grid. Single grid amount = investment amount / number of grids.
5. Trigger price, take profit and stop loss:
The trigger price is when it doesn't trigger at that moment, but starts when the price reaches a certain level. Take profit means closing all positions in that grid when the price reaches a certain point, while stop loss means closing all positions when the price drops to a certain point.
The actual effect of grid trading
In fact, it helps you place buy orders in the lower half of the range and sell orders in the upper half.
During operation, it can also show your profit and loss situation, and you can end the grid at any time.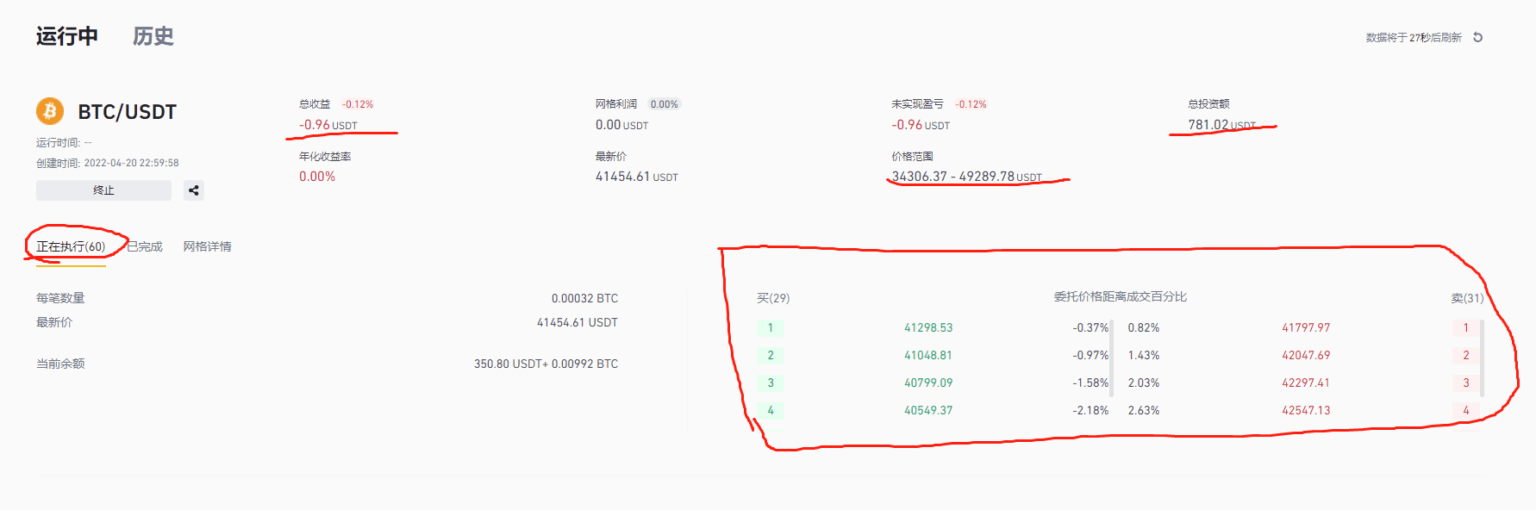
The image above shows the price range, total investment amount, number of grids (60 trades), and the actual orders placed.
When is grid trading suitable and when is it not?
It is more suitable for oscillating markets, suitable for bear markets, and not suitable for bull markets.
In a bear market, there are many oscillations, and prices generally operate within a certain range, with clear resistance and support. Usually, the lowest price of the grid is the support, and the highest price is the resistance. Once it breaks out, it leaves the oscillation.
The benefit of oscillation is that the price constantly swings within a range, buying low and selling high, buying again when the price returns, and selling again after it rises. You earn money every time it oscillates.
As shown in the figure below, the Bitcoin market over the past four months has been oscillating within the range of 36,000-48,000, and the intermediate price has basically experienced six instances, allowing you to earn money six times.
In a bull market, prices rise every day. If you sell all your coins in the upper half of the grid, you are basically missing out.
Of course, if you run the grid early in a bear market, you earn early; if you run late, you earn late. No one knows when you will come out of the grid, which is the awkward part.
Once you move out of the range, don't grid anymore unless you find new resistance and support to form a new range.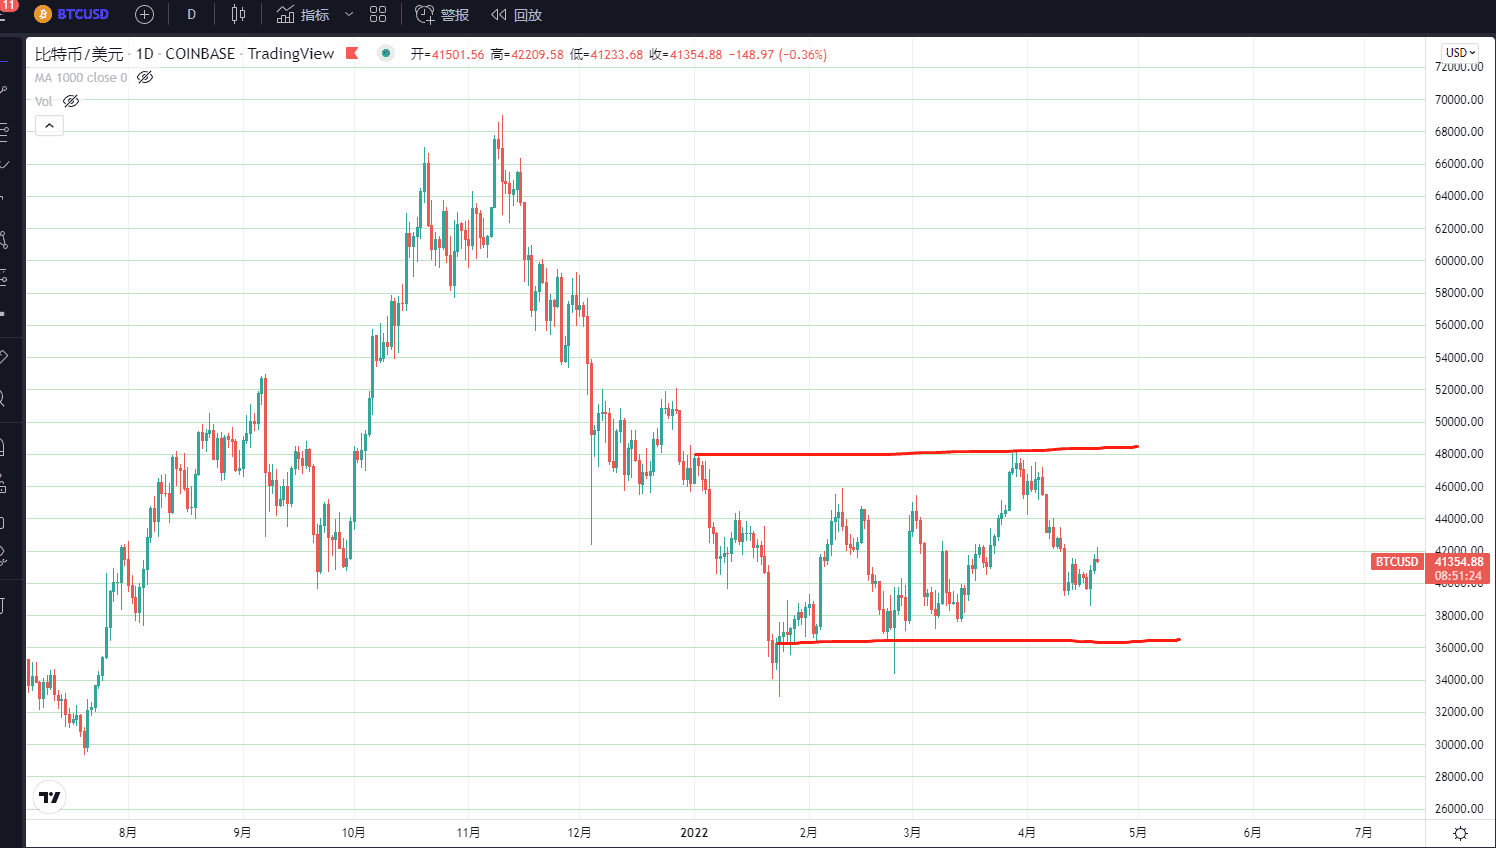
Bitcoin's oscillating market
I personally recommend you to do the exchange rate grid.
The trend of coin to USDT is quite easy to be unilateral. If it is a valuable coin and the market is good, it will generally rise, and you will definitely sell it high. If it is a worthless coin and the market is poor, it will generally fall.
However, the exchange rate trend between coins is different and tends to be more stable.
Choose two coins that you believe have value and are prepared to hold long-term to trade their exchange rates.
For example, in the image below, the exchange rate of ETH and BNB has been oscillating between 0.13-0.16 for a year. Although the range yield is not large, it is stable.
This mindset is better, as you are holding coins long-term. Since you're idle, earning some coins feels good.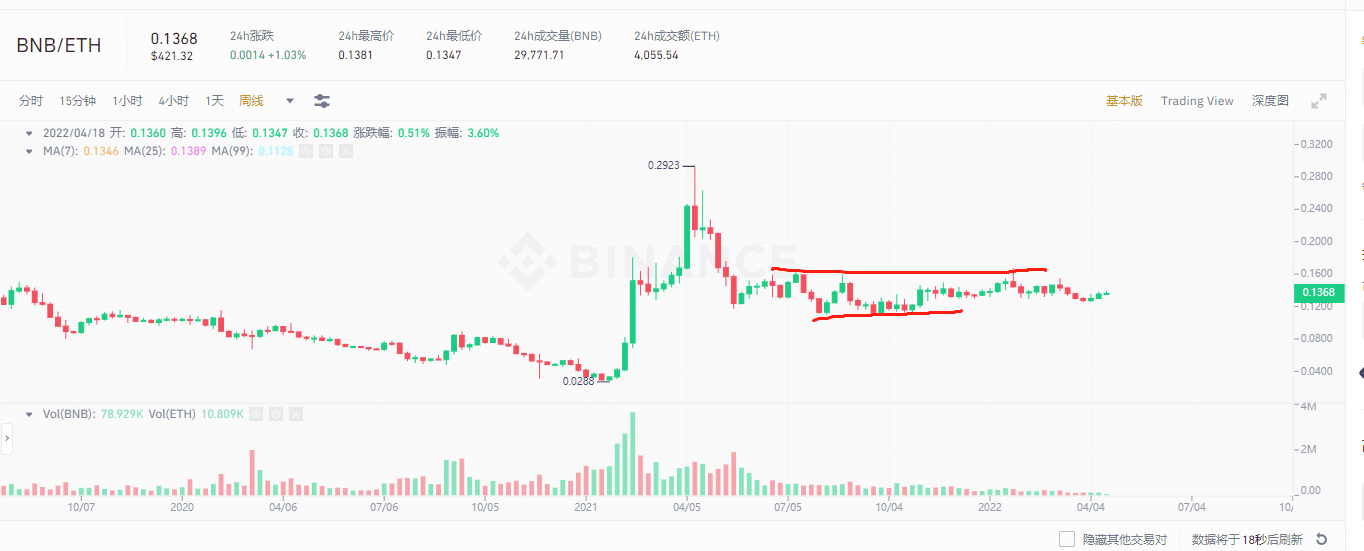
The exchange rate of BNB/ETH stabilizes between 0.13-0.16.
Binance's grid trading feature
Both spot and futures on Binance support grids. Personally, I suggest you just play with spot grids; there's no need to play with futures grids; that's too greedy.
In spot grid trading, prioritize playing the exchange rate grid, followed by the grid for USDT.
1. The functional entry is in Trading - Strategy Trading, available on both the app and website. The specific features have already been discussed, so I won't elaborate further.
2. For strategy creation, Binance has a "one-click creation" feature. The system will provide recommended parameters based on technical analysis (support and resistance). Generally, just using it is fine, which is more worry-free and similar to the manual approach.
Summary
It is recommended to do exchange rate grid trading for coins you are holding long-term in a bear market, using the recommended parameters from Binance's grid trading feature "one-click creation."$BTC $ETH
