
SUI stock confirmed $SUI
A shift in the bullish market structure after breaking a new swing level from the $2.22 area. After a sharp rise, the price is now consolidating at a strong support confluence point, signaling that the uptrend remains intact and may be ready for another bullish wave.
SUI stock's price movement ($SUI ) showed strong bullish momentum after reclaiming support at the higher timeframe of $2.22. This breakout supported a sharp rise that reclaimed the low in the value area and surged strongly through the point of control. Now, the price is retracing, not as a sign of weakness, but as a bullish correction to a multi-factor support area.
Key technical points
Market structure breakout confirmed: A new swing level has formed, flipping the market structure to bullish.
Strong support confluence below: The current retracement has reached the support level at the sell point, an active bullish order block, a BOS/SR reversal, and a Fibonacci retracement of 0.618.
Healthy higher low being traded: Stability in this area confirms trend continuity and paves the way for higher targets.
The next key resistance level is at $3.49: A breakout of this level will confirm the continuation of bullish momentum towards new local peaks.
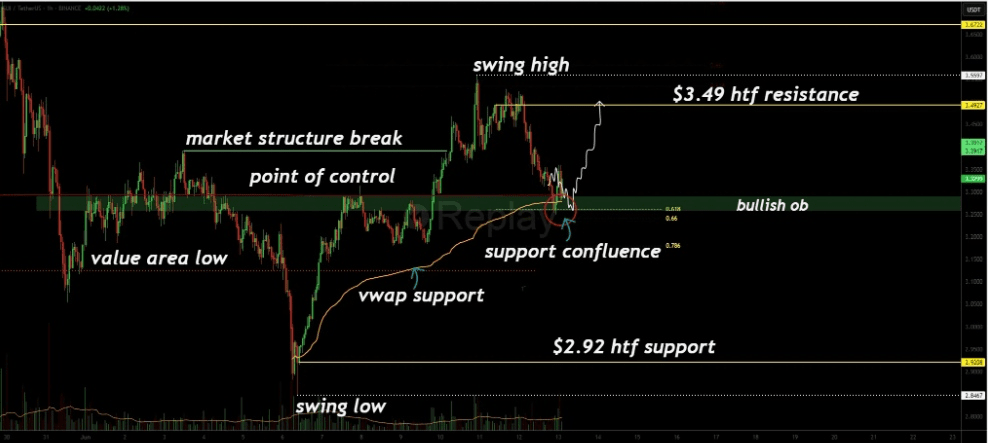
Chart #SUIUSDT (one hour),
After rising from the $2.22 level, SUI registered a sharp increase, confirming a market structure breakout. This breakout was technically significant, accompanied by strong price action that easily breached key resistance levels. The price's recovery to the low of the value area, followed by a smooth movement through the point of control, indicates strong demand and trend stability.
The current pullback is now retracing to a strong support cluster. This includes:
Point of control
Bullish order block
Fibonacci reversal/Boston Stock Exchange (BOS/SR)
Fibonacci retracement 0.618
This makes it a high demand confluence area, and a logical place for the price to form a higher low, keeping the bullish structure intact.
As long as this area holds, $SUI stock is structurally positioned to move towards the resistance level of $3.49, which is the next key level in the local trend. A breakout of this area could lead to a new buying wave, paving the way for higher highs.
What can be expected in the upcoming price movement?
SUI stock is still in a bullish structure following its recent breakout. If the current support confluence area holds, the next bullish wave may target the $3.49 level, and possibly more. However, failure to maintain this area will invalidate the higher low and introduce deeper correction targets. Until then, the bias remains bullish.
🟢 You might also be interested in 👇
Trump talks tariffs, Bitcoin retreats: These two alternative coins are gearing up for takeoff
🇾🇪🇾🇪🇾🇪🇾🇪🇾🇪
