Want to know what top traders are watching before entering a trade?
It’s not hype. Not random tweets.
It's candles — those colorful bars on your chart that silently scream Buy, Sell, or Wait.
Let’s break it down like a pro—no jargon, just clear insight.
---
🔍 What Are Candlestick Patterns?
Candles tell a story.
Each one shows what happened in a set time—like 15 minutes, 1 hour, or 1 day.
Green Candle = Buyers dominated (price closed higher than it opened)
Red Candle = Sellers were in charge (price closed lower than it opened)
But the real magic is in the shapes and combinations.
---
🧠 Why Candlestick Patterns Matter?
They’re not just visual noise.
They reveal momentum, market sentiment, and possible trend reversals.
Think of them as the market’s body language—one quick glance and you’ll know if bulls are getting stronger… or if bears are waking up.

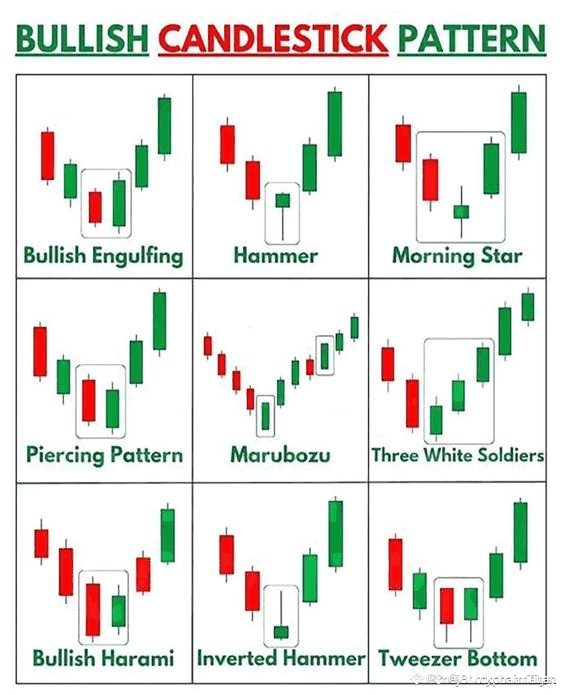
📊 7 Powerful Candlestick Patterns Every Trader Should Know:
1. Doji
Looks like a cross (+).
Shows indecision. Reversal coming? Maybe. Wait for confirmation.
2. Hammer 🔨
Small body, long lower wick.
Buyers stepped in hard after sellers tried to drag it down. Bullish signal.
3. Shooting Star 🌠
Small body, long upper wick.
Price spiked, then collapsed. Bears said “No more.” Bearish warning.
4. Bullish Engulfing
A big green candle eats the previous red one.
Signals strength. Often sparks upside.
5. Bearish Engulfing
Big red candle wipes out the last green one.
Momentum shifting to sellers.
6. Morning Star
A 3-candle combo that shows trend reversal from down to up.
Great sign for buyers if confirmed with volume.
7. Evening Star
Opposite of Morning Star.
Time to take profit or tighten your stop-loss!
---
🚨 How Pro Traders Use Candles on Binance:
✔ They combine candle patterns with indicators (RSI, MACD, Volume).
✔ They wait for confirmation — never jump on the first hint.
✔ They zoom in/out — patterns look different on 15m vs 1D charts.
✔ They follow momentum — big candles near key levels are signals, not noise.
---
🧪 Real Example from Binance Charts:
On $BTC/USDT, a hammer candle appeared at $56,800 after a sharp drop. Volume surged.
Within 48 hours, Bitcoin bounced to $61,200 — a solid +7% gain just by reading the candle's message.
---
🧠 Final Tip: Candle Patterns + Patience = Profits
Candles won't predict the future, but they help you understand the present.
Train your eyes. Backtest on Binance. Observe how price reacts.
Then enter with logic, not emotion.
---
🔥Start watching candles like a pro.
Because while the crowd chases FOMO...
Smart traders read the chart’s story — one candle at a time.
#TradingTips #CandlestickPatterns #BinanceTraders #BinanceHODLerRESOLV #BTC110KSoon?
