On Tuesday morning in Europe, XRP was trading at around $2.30, continuing its rebound momentum for two consecutive days, bringing its price back to the upper half of a seven-month range, which has been confined between $2.00 and $2.80 since last December. Analyst Quantum Ascend believes this compression phase is now approaching a technical pivot point that will determine whether the next move is a strong third wave rally or a final second wave drop.
XRP tightens to the decision zone
In a video released on June 9, the trader pointed out: "We have been in this range since early December... fluctuating between $2.80 and $2.00." He then zoomed in on the video, showing what he deemed the only "reasonable" Elliott wave count: a five-wave rise from last year's low, followed by a five-wave corrective pullback. "What we are seeing now is the five waves in the downtrend... this is the macro second wave... now we are waiting for the three, four, and five waves," he stated, adding that while he tactically shifted to "altcoins with more remaining funds," XRP still accounts for about 12.5% of his portfolio.

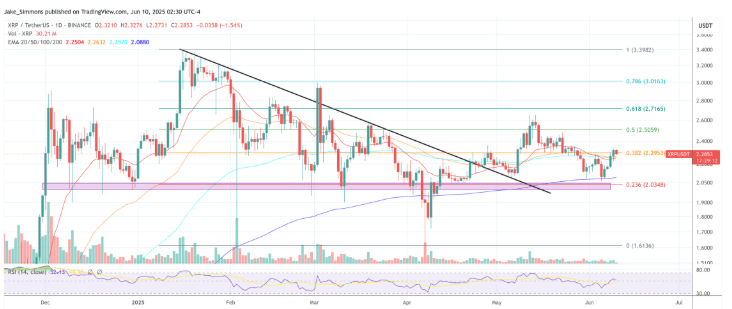
The Fibonacci chart from Quantum Ascend shows that the token has retraced slightly above the typical depth of a second wave pullback at 50% of the previous wave's rise, and the sell-off bottomed in the price range overlapping with the previous wave's fourth wave. "It makes a lot of sense; this is our best position for a rebound," he told viewers after mapping the corresponding chart of the price lows with the 0.5 Fibonacci level.
He emphasized that whether this rebound develops into a sustained breakout ultimately depends on market leaders: "I think Bitcoin will make the decision for us," he noted, emphasizing that XRP's fate remains closely tied to any directional judgment of BTC. In his view, Bitcoin's advance toward key retracement resistance may drag major altcoins, including XRP, into their respective pivot points.
The analyst currently identifies the 0.618-0.786 Fibonacci range (corresponding to $2.42-$2.52) as the "decision zone." "We must be cautious about an area... statistically, this is the area where we are most likely to flip between $2.42 and $2.52," he warned, outlining the risk of XRP forming an ABC zigzag pattern and re-testing lower support before a larger impulse wave begins. If XRP breaks below this range, it will resemble a typical complex second wave, which will last for one final false breakout of early bulls before handing control over to the bears.
The macroeconomic situation may soon escalate. The next potential catalyst for XRP's volatility is the deadline set by the U.S. Securities and Exchange Commission (SEC) on June 17 for Franklin Templeton's spot XRP exchange-traded fund (ETF) proposal—some trading sectors believe this ruling is similar to the Bitcoin ETF moment in January. Although ETF speculation helped XRP's price recover this month, XRP is still nearly a dollar lower than January's historical high of $3.40, so the range of $2.42 to $2.52 will become the most significant technical barrier in the short term.
Currently, traders will focus on whether the current rally can close within (or even above) this range. If it can decisively break through, the Quantum Ascend's third wave theory will be validated, initiating a robust trend targeting the mid-$3 range. Conversely, if it fails to break through, it could ultimately drop below $2 before re-establishing a larger bullish structure. Regardless of the outcome, this analyst remains optimistic: "Whether it rolls back here again or ends here—it's all fine, because in either case, the ultimate outcome is the same."
As of the time of this report, XRP is trading at $2.28.