Ethereum extends its losses below $2,500 with a nearly 1% drop at press time on Monday. The price action warns of a reversal with an evening star pattern, characterized by a 2% rise on Saturday, followed by a Doji candle on Sunday.
Notably, Ethereum failed to reclaim the lost $2,600 floor during the Thursday crash, projecting strong headwinds overhead. Furthermore, investors must remain cautious as the momentum indicators signal rising selling pressure.
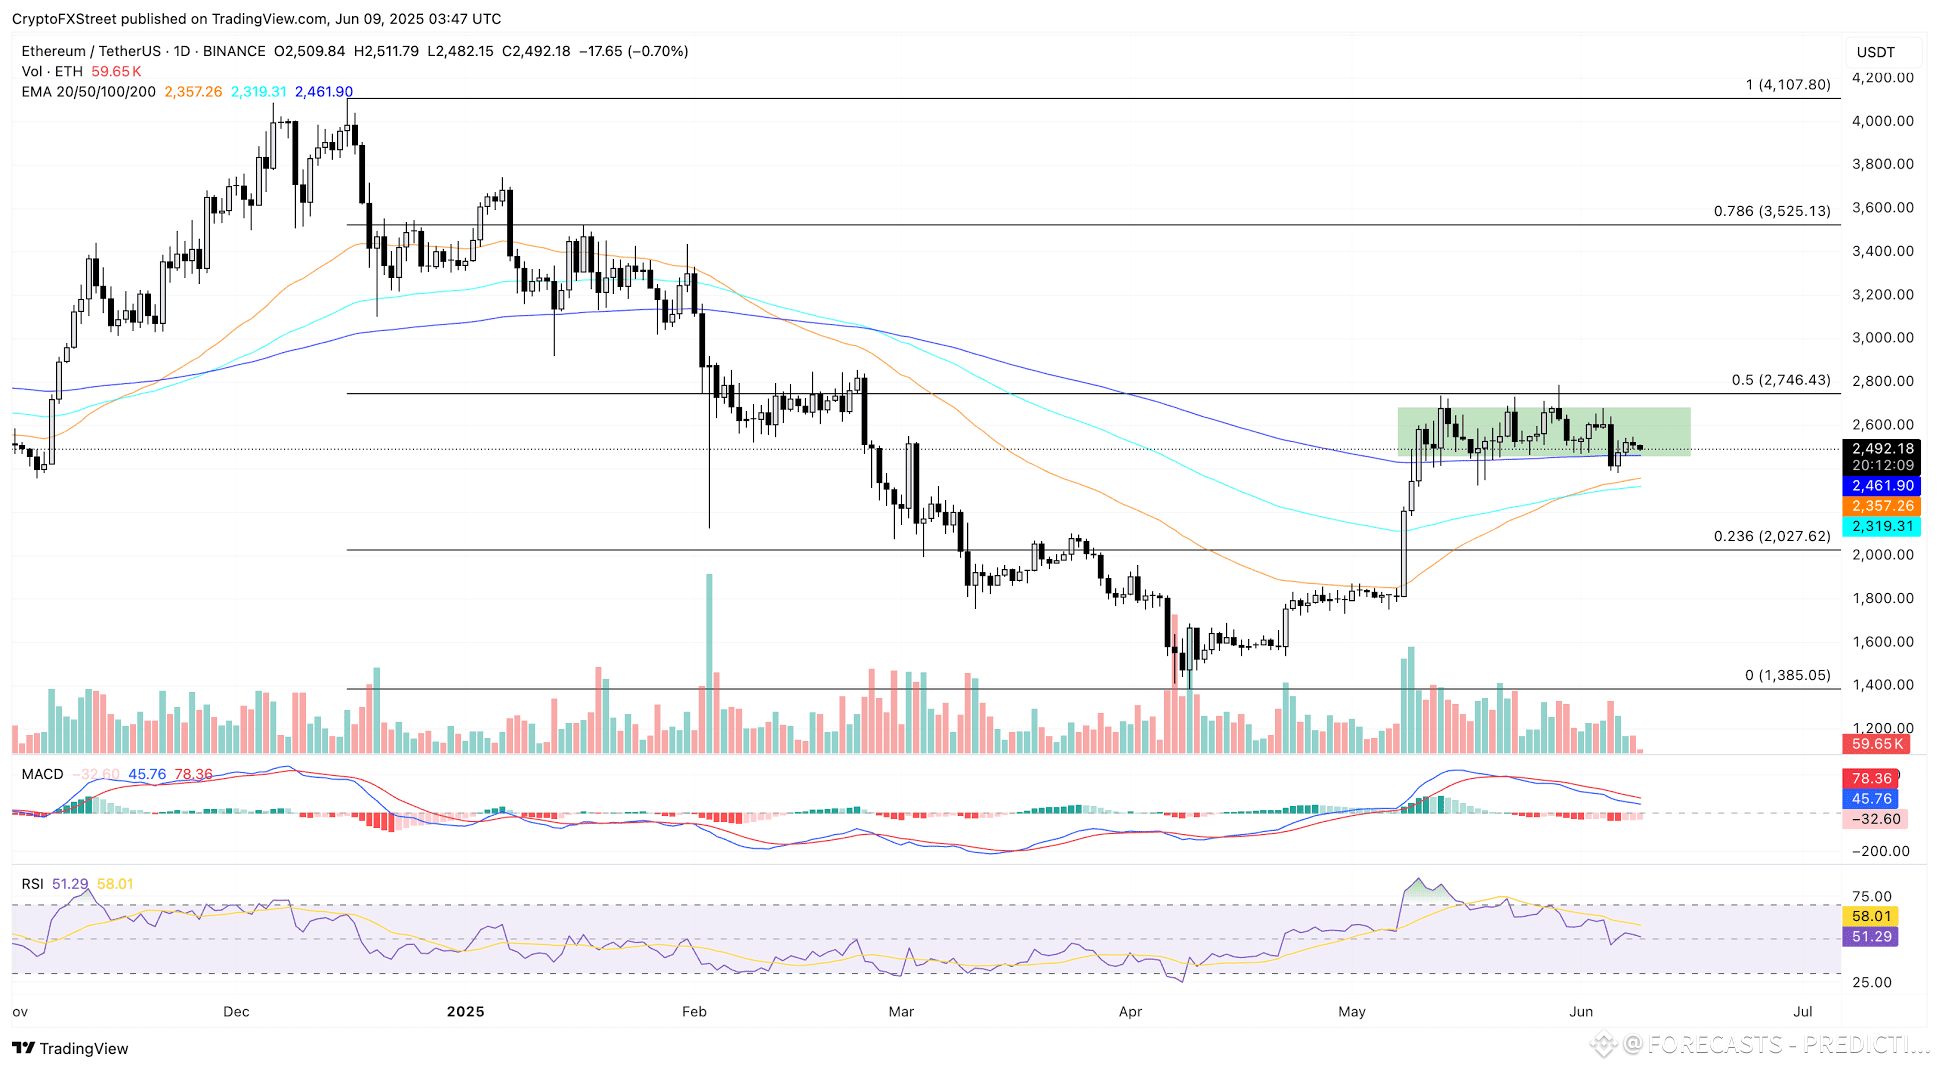
The MACD and its signal line decline towards the zero line, while the red histograms surge below this line, indicating a downtrend is in play. The daily RSI line steps towards the halfway line, diverging from the sideways trend in Ethereum. This marks a bearish divergence, warning of a steeper correction.
Traders can find selling opportunities if the biggest altcoin closes below the 200-day Exponential Moving Average (EMA) at $2,461, with the next support at $2,357, the 50-day EMA.
Conversely, a bullish reversal could encounter resistance at the $2,700 barrier, potentially leading to multiple peaks formed in May.

