After a parabolic rally in early June, the price of Mask Network is currently under strong pressure following a sharp intraday rebound from the $3.70 area. The token has fallen more than 30% from its recent peak, erasing almost all of June's initial gains. Despite the volatility, the price is now testing a critical support level that may determine whether the bulls maintain control in the medium term.
What is happening with the price of Mask Network?

Price forecast for masks (Source: TradingView)
The weekly candlestick chart highlights a sharp reversal after the price of Mask Network rose from April lows around $0.92 to highs of $3.69. This move briefly touched the 61.8% Fibonacci retracement around $3.28 but failed to hold above it. The price is now retreating to the Fibonacci 0.236 zone at $1.82, which currently acts as key psychological support. Maintaining this level may stabilize sentiment after the panic sell-off.

Price forecast for masks (Source: TradingView)
On the daily timeframe, the price has decisively broken below the support structure of the ascending wedge and is oscillating just above $1.85. A close below $1.82 may open the door for a full correction to the demand zone of $1.60–$1.28, which coincides with previous consolidation levels observed in April and early May.
Price action of Mask Network shows a decline after peaking

Price forecast for masks (Source: TradingView)
Looking at the 4-hour chart, the price action of Mask Network formed a clear ascending triangle at the end of May, followed by a textbook breakout. However, the jump to $3.69 was met with immediate rejection, forming a bearish engulfing candle on multiple timeframes.
The sudden breakout breached the previous support at $2.70 and triggered a cascade of stop-losses. The price is now consolidating in a narrowing triangle just above $1.84, with the downward momentum slowing. However, lower highs signal caution. If this current structure breaks down again, the support zone of $1.60–$1.28 may be quickly tested.
Why is the price of Mask Network declining today?
Price forecast for masks (Source: TradingView)
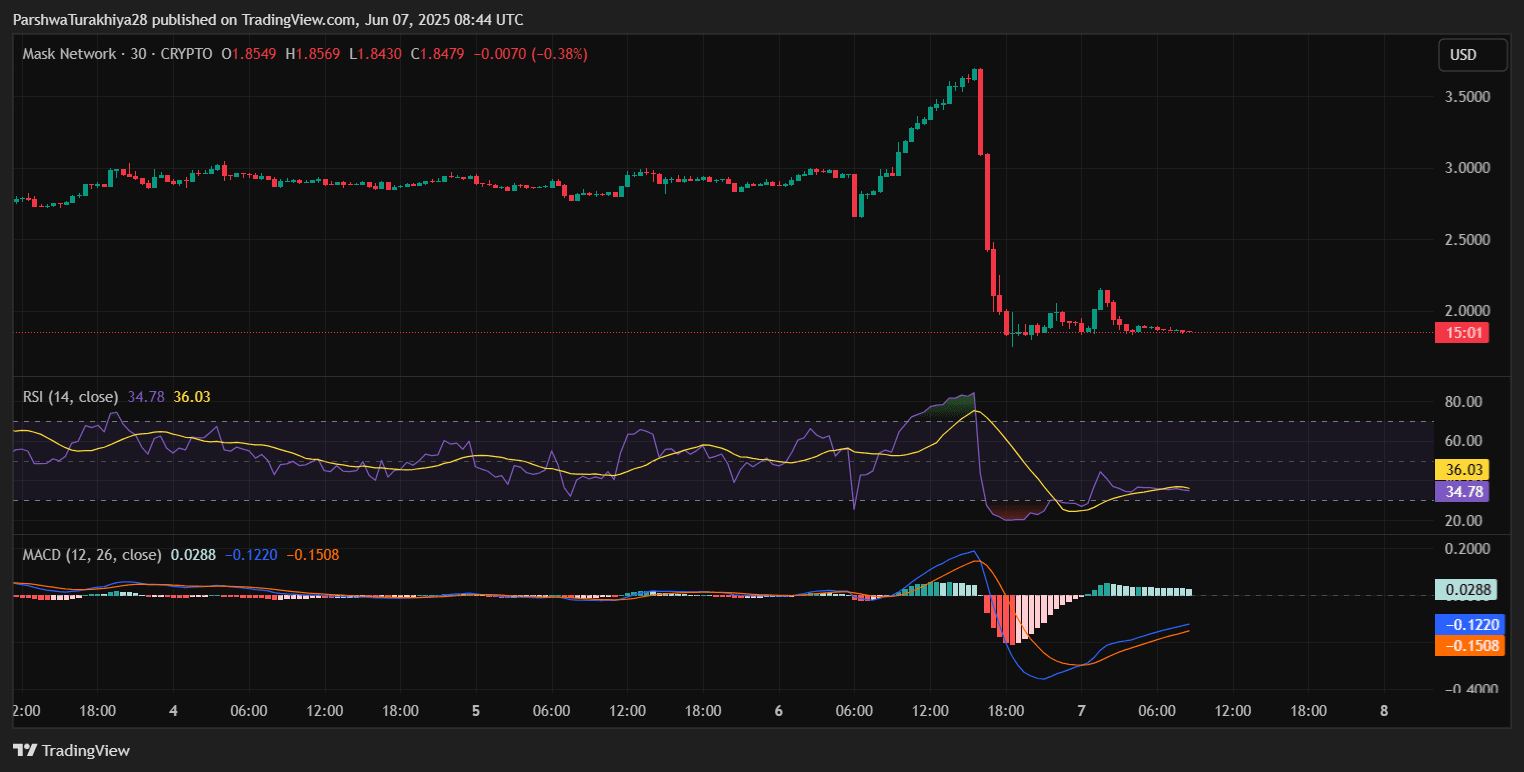
The answer to why the price of Mask Network is falling today lies in several converging factors. Firstly, the RSI on the 30-minute and 4-hour charts shows bearish divergence at the top, followed by a breakout into the oversold zone (levels below 35), signaling exhaustion of bullish momentum.
Moreover, the MACD printed a bearish crossover around the same time the breakout occurred. The histogram bars sharply shifted into negative territory, reinforcing the trend reversal. This momentum structure indicates a broader correction phase rather than a simple pullback.

Price forecast for masks (Source: TradingView)
Furthermore, the Ichimoku Cloud on the 30-minute chart now shows a deep bearish turn, and the price action is significantly below the Kumo cloud. The conversion line and baseline are trending downwards, further confirming short-term bearish sentiment. Stoch RSI remains below 20, indicating that momentum remains weak despite the attempted rebound.
Volatility spikes and short-term forecast

Price forecast for masks (Source: TradingView)
Following a cascade of liquidations, the volatility of Mask Network's price has surged to its highest levels in recent weeks. The Bollinger Bands on the 4-hour chart have significantly widened, and the price is now trading below all key EMAs (20/50/100/200), indicating that any rebound will face serious resistance ahead. The upper band at $3.73 marked a peak, while the lower band around $1.65 may be retested.
The volume during the decline was significantly higher than during the rally, indicating distribution rather than accumulation. However, if the bulls can defend the $1.82 area and reclaim $2.12 on a 4H close, it may signal the start of a short-term recovery.
MASK price forecast for June 2025.

Price forecast for masks (Source: TradingView)
Given the current chart dynamics, the price remains vulnerable unless it can reclaim the lost trend lines. As of June 7, the price of Mask Network is holding at $1.84, but momentum indicators suggest caution. Here’s a summarized short-term forecast:
Indicator Reading
RSI (4h/30m) 34.7 / 36.0 (bearish)
MACD (30m) Bearish crossover
Ichimoku (30m) Price below the cloud
EMA (4H) All above prices
Key support $1.82 / $1.60 / $1.28
Resistance levels $2.12 / $2.50 / $3.28
Fibonacci retracement targets 0.236 = $1.82, 0.382 = $2.38
As long as $2.12 is not reclaimed on strong volume, broader prospects remain cautious. If support at $1.82 fails, bears may target the $1.60–$1.28 region, where demand previously absorbed selling pressure. A successful reclaiming of $2.12 may revive the push towards the 38.2% Fibonacci level at $2.38.