

Introduction
In the cryptocurrency market, the liquidity of stablecoins is always a highly valuable reference indicator, with USDC (ERC20) being a typical representative. Observing the net inflow (Netflow) to exchanges can effectively predict subsequent market trends.
This article will use the USDC (ERC20) Netflow indicator from the on-chain tool CryptoQuant to set three clear conditions and conduct a historical backtest with TradingView, demonstrating its relationship with price, thereby seeking potential trading opportunities.
We found that when specific conditions are met, BTC usually shows a significant and sustained upward trend, which can assist traders and investors in making more precise judgments.
Netflow conditions and CryptoQuant charts
Reference: https://x.com/tocuee/status/1885303852205006861
The conditions for this analysis are as follows:
Condition 1: Single-day USDC (ERC20) net inflow (Netflow) amount greater than or equal to 100 million USD (100M).
Condition 2: Continuous 3-day USDC (ERC20) net inflow, with at least 100 million USD net inflow each day.
Condition 3: Single-day USDC (ERC20) net inflow (Netflow) amount exceeding 600 million USD (600M).
According to historical data:
When condition 1 and condition 2 are simultaneously met, the market usually enters a noticeable upward trend.
WhenCondition 3 is also metthe increase in BTC typically exceeds30% or more.
The logic of these three conditions is as follows:
A large net inflow of USDC usually indicates that funds are beginning to flow into exchanges for buying, suggesting that the market is about to welcome more capital to push prices up.
Continuous inflow of funds for 3 consecutive days indicates increased market confidence and stability, maintaining purchasing power and forming a noticeable trend.
Inflow exceeding 600 million USD represents institutional or whale-level capital entering the market, often leading to stronger and more sustained upward trends.
Netflow conditions and BTC's price behavior

From 2023/01/01 to 2023/07/31, the situation of USDC (ERC20) net inflow

From 2023/01/01 to 2023/07/31, the price behavior of USDC (ERC20) net inflow
From the figure below, it can be seen that when condition three was triggered on 2023/03/10, the price increased by more than 30%, while on 2023/03/01, conditions one and two were triggered but then failed, with the rest being an increase.

From 2023/01/10 to 2023/06/19, the conditions for USDC (ERC20) net inflow and BTC's price behavior

From 2024/03/01 to 2024/10/31, the situation of USDC (ERC20) net inflow

From 2024/03/01 to 2024/10/31, the price behavior of USDC (ERC20) net inflow
We can see from the figure below that when conditions one and two are met, BTC's price always increases (from 17% to 31%)

From 2024/03/06 to 2025/09/09, the conditions for USDC (ERC20) net inflow and BTC's price behavior

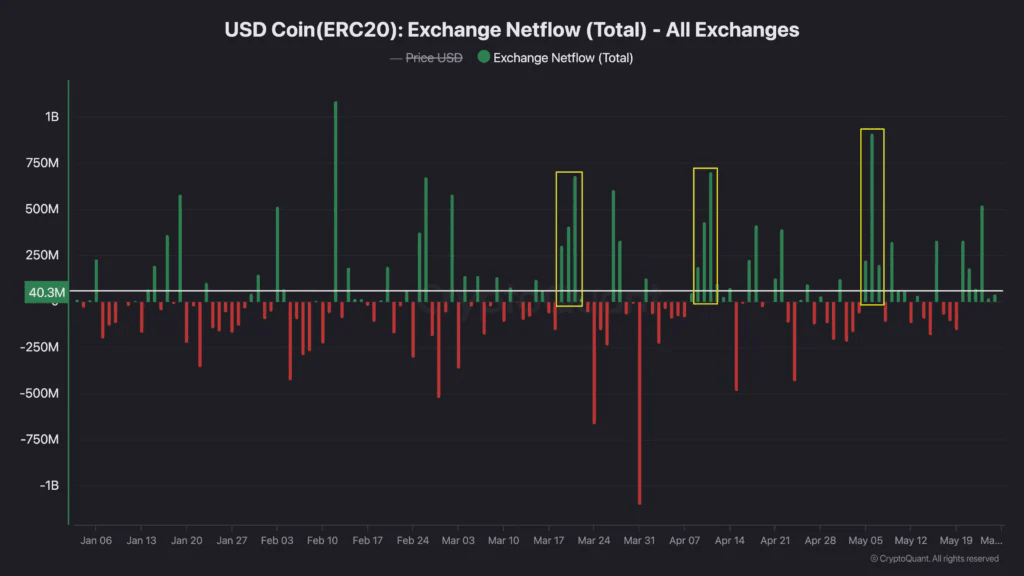
From 2024/11/01 to 2025/05/25, the situation of USDC (ERC20) net inflow

From 2024/11/01 to 2025/05/25, the price behavior of USDC (ERC20) net inflow
We can see from the figure below that when conditions one and two are met, BTC's price always increases (from 7% to 55%)

From 2024/11/04 to 2025/05/05, the conditions for USDC (ERC20) net inflow and BTC's price behavior
Summary
This article conducts a historical backtest using CryptoQuant's USDC (ERC20) Netflow indicator, pointing out that when large amounts of stablecoins flow into exchanges, it often accompanies significant price increases in the Bitcoin market. During the sample period from 2023/01/01 to 2025/05/05, we observed:
Condition one and condition two were simultaneously met 14 times, with an average increase of 22.78%, of which only once did not lead to an increase;
Condition three (large single-day inflow) occurred only once, and BTC subsequently rose by more than 34.98%;
This indicates that the three Netflow conditions possess high indicator significance, especially when the inflow amount exceeds 100 million USD for three consecutive days, often signaling a trend of institutional or large investors entering the market, reflecting a turning point in market liquidity.
In practice, this model can serve as a reference signal for investors before making bullish arrangements, especially suitable for strategic capital allocation and setting triggering conditions for quantitative trading strategies. In the future, it could also further observe the applicability of this model to different stablecoins (such as USDT, DAI) or other on-chain assets, enhancing its value as a cross-chain capital trend observation tool.
In summary, the behavior of USDC net inflow not only reveals potential changes in market direction but can also serve as an early signal for anticipating bullish trends, making it a factor worth incorporating with a medium to high weight in investment strategies and tracking.
This report is for informational sharing purposes only and does not constitute any form of investment advice or decision-making basis. The data, analysis, and opinions cited in this article are based on the author's research and public sources, and may be subject to uncertainty or change. Readers should make investment judgments cautiously based on their own circumstances and risk tolerance. For further guidance, it is advisable to seek advice from professional consultants.
