On the hourly level, it is still synchronized with Bitcoin, showing no particularly outstanding performance. Under the strong circumstances of Ethereum, SOL cannot steal the spotlight and needs to wait for Ethereum to finish its performance before SOL can take over. Of course, we hope to see a situation where Ethereum and SOL compete to rally.
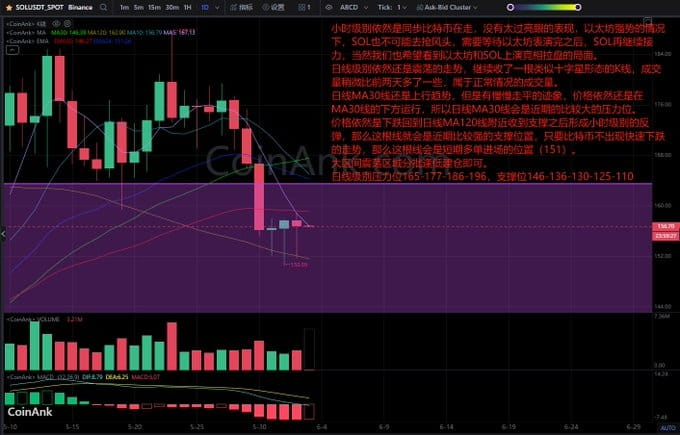
The daily level still exhibits a fluctuating trend, continuing to form a candlestick similar to a doji. The trading volume is slightly higher than in the previous two days, which is a normal trading volume situation.
The daily MA30 line is still in an upward trend, but there are signs of gradually flattening. The price is still operating below the MA30 line, so the daily MA30 line will be a significant resistance level in the near term.
The price has fallen back to near the daily MA120 line and has received support, forming a rebound at the hourly level. This line will be a relatively strong support position in the near term. As long as Bitcoin does not show a rapid downward trend, this line will be a short-term entry point for long positions (151).
In the large fluctuation range, accumulate positions in batches when the price dips.
Daily resistance levels are 165-177-186-196, support levels are 146-136-130-125-110.
From the liquidation heat map of SOL, it can be seen that
the price is rising, with a large number of large and extra-large short positions waiting for liquidation in the 157.2-163.2 area.
the price is falling, with a large number of large and extra-large long positions waiting for liquidation in the 151.4-146.4 area.


