In December 2024, I quit my job at a large company to trade cryptocurrency full-time. I rented a server, first created a robot girlfriend to wake me up every day, and then made a monitoring robot to watch the market 24/7. I tried various strategies online, opened over 3,000 contracts in five months, and yesterday I transferred funds from an exchange to Binance, where the community is lively and not so lonely. After several months of watching the market, writing code, eating, and sleeping, without any social interaction, I felt almost silly. I wrote some things, and if anyone finds it useful, we can exchange ideas.
When I first entered the market, I always believed that the techniques for making money are not taught by others.
This viewpoint is wrong; the techniques for making 100% big money are not taught by others.
In recent years, bank interest rates have been continuously declining, so my family took out savings from the bank to invest in stocks, resulting in a loss of over 2.5 million. This viewpoint mainly formed from being scammed in speculative markets; just leaving a phone number online would attract various masters asking you to join groups, recommending various stocks, and asking you to install various software. Various trading strategies, such as leading stocks strategies, low-buy strategies, and end-of-day buying strategies, are dazzling.
So when I first entered the crypto world, I scoffed at some online teachings. But I was frustrated because I couldn't find a buying method. I followed my instincts and bought at a loss sometimes and made gains at others, but my small account barely moved for a month or two, feeling lonely. So at the end of March, I watched a few big streamers' live streams with a 'let's see' attitude. Actually, their methods were basically the same. The main focus was on judging whether the K-line trend had a box range, trend lines, whether there were resistance and support levels, going short when the rise reached the resistance level, and going long when the drop reached the support level. It’s best if the hourly, daily, weekly, and monthly lines can resonate. Then, check the news for any favorable or unfavorable conditions to make preventive measures in advance.
Starting from April 1st, I began to apply the methods I learned, commonly known as 'left-side trading'. On the third day, I found the results were decent. I was opening 20 to 30 contracts daily, with a winning rate of over 60%. There were both profits and losses daily. At this point, I discovered a problem: as long as I opened enough contracts, and my winning rate was slightly above 50%, I could leverage the daily profit and loss hedging to show that I had daily profits on my calendar.

From April 1st to April 16th, there were more than 20 contracts daily in my account that remained unclosed. Every night before midnight, I checked which contracts had turned bad and were losing. I paired those contracts that were profitable but underperforming to ensure that the total profit and loss for the day was positive.
So some online screenshots showing daily profits might not necessarily be photoshopped. If you follow the methods above, opening dozens of small positions during oscillating markets, everyone can create a very beautiful profit calendar. On the 6th, I lost control and traded a newly launched meme token, resulting in increasing losses. No matter how many profitable positions I closed at night, I couldn’t compensate for the loss, so the 6th ended up being a losing day.
At that time, I felt a bit carried away, as if I had found the true essence of trading cryptocurrency, preparing to increase my investment. My biggest doubt was: if this method is so effective, why would the teacher want to teach everyone? Wouldn’t it be better to make money quietly? Isn’t this a game of picking each other’s pockets? Every time in the live broadcast room, so many people learned the method; how should this zero-sum game market continue?

Until April 17th, this method suddenly stopped working overnight; all contrarian short positions only lost without gains, and even 3x leveraged shorts got instantly liquidated. Only a few long positions slightly compensated for the losses. During those days, market sentiment was very high, with altcoins rising in turn. I traded a meme token called #magic and got liquidated three times consecutively on my short positions, even 1x leveraged shorts were wiped out. At this point, I understood why teachers were willing to teach methods; left-side trading isn’t always effective. When a strong trend comes, it can directly break through four or five key levels (or possibly crash through). However, the more people use a method, the more effective it becomes; the pattern can cycle and strengthen. Left-side trading and right-side trading are like two major factions; whoever is stronger makes more money. Some technical aspects still need to be learned, as they are at least higher in winning rate than blindly trading.
Never easily open hedges, as unlocking can be very difficult.
Starting from April 19th, I changed strategies to use right-side trading, which means waiting for trends to break through resistance levels to buy or fall below support levels to sell. Since I needed to wait for the market to show a broad rise to confirm a trend, so far, only April 28th and May 9th have been representative time points. On April 28th, I opened 16 contracts, and on May 9th, I opened 10 contracts, all long positions. At that time, the plan was to catch one or two coins that doubled and to promptly stop losses on others whose trends went bad. During this wave of broad market sentiment in late April, my account indeed had a period where floating profits exceeded floating losses, but it was hard to grasp the selling timing, leading to missing the opportunity to sell the last few doubling coins before their pullbacks, while the losing positions were already closed due to the K-line trend deteriorating, resulting in an overall loss.

For example, at the end of April, I traded a meme token #vine . When it surged, it doubled, but I didn’t close it in time and only came out breaking even, while other contracts at the same time had already closed at around -10%.
Due to often making opposite directions, I tried the locking method taught by online teachers, for example, after opening a long position, if the trend continues downward, I can open a proportional short position, fixing the loss at the current amount. To be honest, locking positions does relieve the psychological burden significantly, but the problem arises when unlocking; it originally only required judging one direction and one turning point. After opening a hedge, it requires judging two later, doubling the difficulty. It’s more comfortable to do hedging when K-lines oscillate within a box, as the key points are clear: close the long positions when it surges, and close the short positions when it reverts. However, in most actual situations, there aren’t such obvious boxes; opening a hedge indeed locks in losses, but when closing, there’s no clear approach. In several cases, hedging isn’t meaningful and might even lead to greater losses.
First situation: Hedged under a unilateral trend, this should directly stop loss. Because after hedging, encountering any temporary pullback can easily be mistaken for a bottom rebound, closing the hedge position, then the trend continues, exacerbating the original loss.

A quick graph comparison makes it clear that in such a unilateral market, timely stop losses are the true 'lock-in of losses'. The left graph does not consider liquidation situations. If the liquidation line is nearby, you might wake up after a sleep to find both contracts gone, hit by double explosions. In April, I often went to bed with 20 contracts, and when I woke up, only 16 were left.
Second situation: Hedging under an oscillating trend with the same position size; if it’s not a very strong box oscillating, it’s hard to unlock without losses.

Casually drawn an irregular oscillating market. Ideally, you need to close short positions in the ④⑤ interval, and then close long positions in the ①② interval to turn losses into profits. But in reality, when the trend reached point k, the long positions were liquidated, so in practice, it’s necessary to close long positions before point k when there is profit, that is, near point d, and then close short positions in the ④⑤ interval. However, post-analysis is always from a god's perspective, each second on the trend line can be a buying or selling point. Many times, short positions were closed in the g→h segment because it felt like the trend stabilized, waiting for a rebound to close the long positions, but the result was that the trend rose for a while and then started to drop, leading to the liquidation of long positions. After another wave of rise, if the previous short positions were still there, they would also be liquidated, forming a double explosion of long and short positions.
When trading meme tokens, one should use contracts and high leverage.
When chatting with friends in the crypto world, I said that when trading altcoins, one should use contracts and high leverage. They all thought I was gambling and getting carried away. In fact, I have always been a risk-averse person with a very cautious style; when I first entered the crypto world, I used at most 3x leverage, and later I opened higher and higher, eventually using 20x leverage on altcoins. There’s a saying that goes, 'reading a book a hundred times reveals its meaning.' After opening over a thousand contracts, I found that in some situations, leverage doesn’t have to be so low; using low leverage not only occupies capital but also increases risk. Real gambling should be about position size, not high leverage.
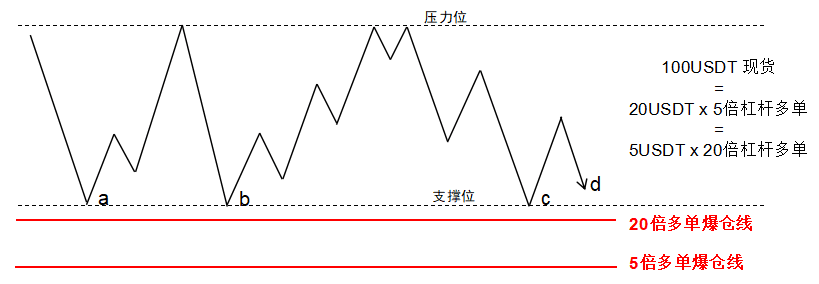
For example, in the above market segment, it is clearly within a box, and both support and resistance levels have been confirmed by the market three times. At this time, if the K-line reaches point d, there is a high probability it will continue the trend and touch the support level for a rebound. If there is 100U available to trade, choosing to open a 20x leverage long position is the most cost-effective because the current support level is strong. If it touches the 20x liquidation line, it can be assumed that the trend has deteriorated, and there’s no need to hold the position until the 5x liquidation line so far away. Altcoins often experience sharp rises and drops; both 5x and 20x leverage can get liquidated in an instant. With the same 100U, after opening high leverage, the remaining 95U can be diversified to look for similar opportunities.
In fact, behind every low-leverage contract and every spot trade, there is a hidden logic: 'I firmly believe in the direction I think, and I am prepared to hold the position'. When the trend and prediction diverge, I hold the position until the trend reverses. This can work for mainstream large-cap coins, but altcoins are very dangerous; they might get liquidated before reversing, and once you start holding, you might add margin due to sunk costs. So if there is a stop-loss expectation before placing a trade, it’s better to simply increase leverage.
A winning rate of over 99% and a return rate of over 30% can still result in losses.
In the contract copy trading square, there are many god-level traders with extremely high winning rates, often over 99%, and high return rates. But I copied two god-level traders, investing 200U each, and three months later, one went bankrupt and ran off, while the other lost 44U of the 200U. My initial purpose was to observe the logic behind the big traders' orders and convert it into my own method, but I unexpectedly discovered many pitfalls.
The first graph below is one of the copy trading interfaces, the detailed data is no longer visible. At that time, the 180-day winning rate was 99.86%, with a return rate of over 30%. The graph showed a stable upward trend, feeling very solid. The number of people copying trades was always full, and it took a long time to squeeze in. The earnings rose from 200U to a stable 223U. During this time, I kept researching the opening records, trading various coins, both long and short positions, but the earnings were very small, roughly between 0.01 to 1-0.5U per contract, with occasional losses around 0.1 to 1U. Until one day, I opened my account to find the balance had become 188U. Upon checking the history, I discovered one contract had lost 35U and it hadn’t been closed. Following that, there was a stable period of profit, and the account returned to 198U, only to encounter another big loss dropping it to 181U, repeating this cycle.

At that time, I looked at the profit graph, which still showed a relatively gentle upward trend, but there were two gaps where losses occurred, similar to the third graph above. Here are two pitfalls: the default profit rate graph’s vertical coordinate is the profit rate, which has no relation to the rise and fall of account funds; profit rates can be high, but drawdown can also be high. A 400% profit rate with a 100% drawdown essentially equals zero. The second pitfall is that the adjacent profit and loss graph, while it also shows an upward trend, should reflect the profit and loss of the trader's capital pool, which contains the profits of others, and should not include the profit-sharing data. Generally, the profit-sharing for traders is 10%. If this profit curve is not steep enough, it may turn downward after deducting the 10% share.
So now, just looking at the existing data makes it hard to judge who the right trading guru is; those with beautiful data might be losing money, and those with poor data might not be losing. It’s still best to operate on your own, as losing won’t feel unjust.
I wrote this much in just two days, and I will write the rest when I have time. I hope it can help everyone.
