Swing trading involves holding a position for several days to weeks to capture short- to medium-term price movements. Unlike day trading, it’s less intense but still requires strong technical analysis and market awareness.
🧠 What Is Swing Trading?
Swing trading aims to profit from “swings” in price action — typically from support to resistance levels or vice versa. It sits between day trading (short-term) and long-term investing.
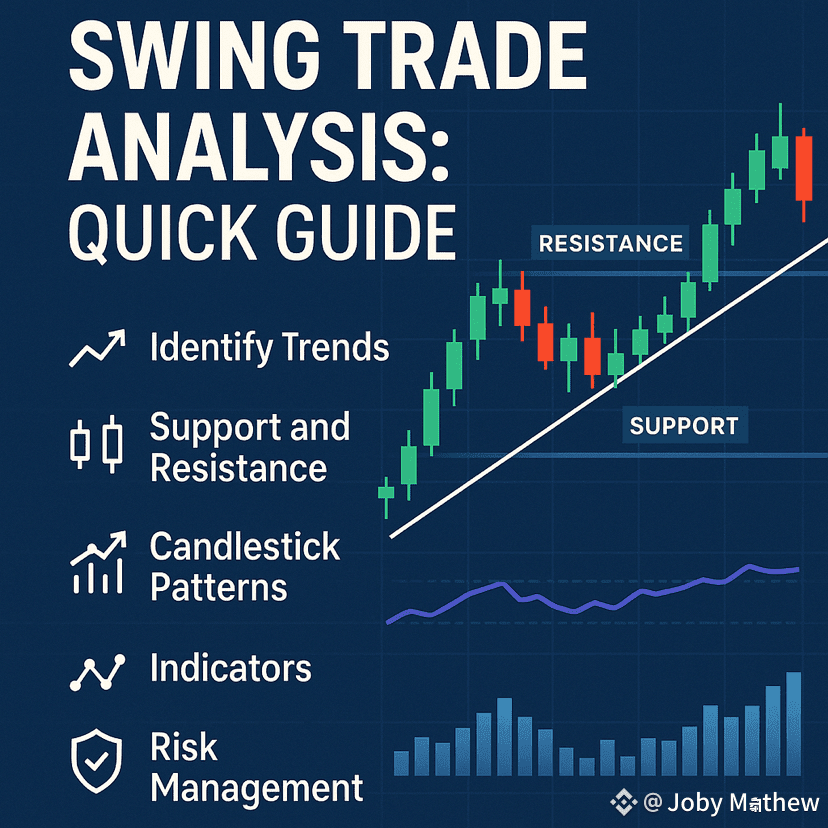
🧮 Key Components of Swing Trade Analysis
1. Identify Trends
Use tools like moving averages (MA) to detect the trend.
Look for higher highs & higher lows (uptrend) or lower highs & lower lows (downtrend).
2. Support and Resistance Levels
These are price zones where the asset historically reverses or stalls.
Buy near support, sell near resistance.
3. Candlestick Patterns
Look for reversal patterns (e.g., hammer, engulfing) or continuation patterns (e.g., flags, triangles).
4. Indicators
RSI (Relative Strength Index): Identify overbought (>70) or oversold (<30) conditions.
MACD (Moving Average Convergence Divergence): Spot momentum changes.
Volume: Confirm breakout or breakdown strength.
5. Chart Timeframes
Use 4H, 1D, or 1W timeframes.
Entry signals on smaller timeframes (1H or 4H), confirmation on higher (1D or 1W).
📌 Swing Trade Example
Asset: ETH/USDT
Buy Zone: $2,400 (near support)
Sell Target: $2,800 (near resistance)
Stop-Loss: $2,300
Risk-Reward Ratio: (400 gain / 100 risk) = 4:1
🔒 Risk Management
Use stop-loss and take-profit levels.
Risk only 1–2% of your capital per trade.
Maintain a trading journal to improve strategy.
✅ Final Tips
Be patient: trades may take days to develop.
Combine technical analysis with market sentiment.
Always backtest your strategy.#BinanceAlphaAlert #TrumpTariffs #BinanceHODLerSOPH #TradingTypes101 #Bitcoin2025
