Smart Money Concepts: The Theory of The Inner Circle Trader May 11, 2023 by X-Trader
Surely in recent months you have started to hear about concepts like Order Blocks, Break of Structure, or Liquidity Voids, all related in some way to a new philosophy of understanding trading called Smart Money Concepts.
To bring a bit of order and explain these concepts with some clarity, shedding light on this sea of names, we start here this series of articles with which I hope to clear up all doubts.
The Origin of Everything: The Inner Circle Trader
To understand what Smart Money Concepts is, it is inevitable to talk about the creator of this trading philosophy: Michael J. Huddleston.

Known on the Internet as The Inner Circle Trader (ICT), Huddleston became popular over 10 years ago when he started the eponymous YouTube channel, publishing videos in which he discussed his trading ideas, his approach to operating in the foreign exchange market, and his view on the impact of psychology in trading.
In case you are encouraged to watch all the videos published by this good man from the beginning, I warn you that some of them last more than 2 hours! Apparently, this long duration is totally intentional, as he himself points out, he likes to leave hidden clues about his methodology in the videos, with the student being the one who must take the time to search for them and investigate thoroughly.
Initially, Huddleston published all his materials openly (in fact, you can find links to his old videos on BabyPips under the pseudonym System, although they no longer work), but later decided to remove much of the original material and create a mentoring service in 2017, which provoked the anger of his followers, receiving a multitude of negative criticisms since then (especially because he originally said he would never charge for the information).
All of this adds to the dark legend that circulates in forums that he managed several million dollars for a family of millionaire Greeks settled in the U.S., to whom he lost quite a bit of money. Thus, Huddleston has become a rather controversial character, defended and hated equally online.
But there is no doubt that, to this day, his methodology based on Price Action has spread widely among traders.
Smart Money Manages the Markets
The starting point of ICT's philosophy is that Smart Money (basically, banks and institutional traders) acts basically as a price manipulator, looking for large accumulations of stop orders residing in the market to trigger them and achieve their goal of executing their orders and those of their clients at the best possible prices. And in Huddleston's words:
"They teach us that the price moves due to supply and demand pressure, and that the direction of the market is determined by the side with more money. This is false. The truth is that they are not going to let the entire financial system be at the mercy of random buying and selling. Using programming to automate markets with an algorithm is much more efficient and reliable."
The algorithm that manages the markets is referred to by Huddleston as IPDA (Interbank Price Delivery Algorithm). The function of the IPDA is to manipulate prices in order to create liquidity in the market. Smart Money, which understands how this algorithm works, manages to take advantage of price movements by exploiting two aspects:
1. Liquidity above/below old highs and lows.
2. Inefficient price action areas.
For all these reasons, understanding when and where the IPDA will manipulate the price is the only way for retail traders to make money, taking advantage of the upward and downward movements that Smart Money creates. And the fact is that absolutely all patterns observed in the charts, such as head and shoulders or trend lines, are generated by the IPDA to attract retail money into the market. Thus, the correct question to ask if we want to make money in trading is: "Where are the stops of the retailers located?"
After reviewing a bit of the philosophical basis of this method, it might be wise to adopt a critical view (in fact, one should always be critical of any trading methodology): although at first glance, the idea that the market is manipulated may seem seductive to many retail traders looking to justify their losses due to such manipulations (how many times have we heard the phrase: 'they went for my stop!?'), the theory behind Smart Money Concepts should be taken with a grain of salt, as it is evident that:
It is unlikely that price action is generated by a single algorithm designed for it.
Institutionals play in a very different league from retailers, with the volumes of the latter being too small to be relevant.
It is true that sometimes price sweeps and false breaks occur, but this does not prove that they are necessarily the result of continuous market manipulation.
However, and although the starting point of this method may be erroneous, one thing I have learned in trading is that one should never discard any idea, no matter how crazy it may seem to us (perhaps we are discarding the Holy Grail and do not know it :P).
Fundamental Concepts
Next, we will define some of the most important concepts used in the methodology developed by ICT and that we will use throughout the following articles.
1. Order Blocks
Order Blocks are specific candles that, when analyzed properly in an institutional context, can highlight the buying and selling of smart money. In particular, we will say that:
A Bullish Order Block is the lowest candle that has a bearish close, which presents the largest body (that is, the distance between the open and close), and is near a Support level. The pattern is confirmed when the maximum of the candle forming the Order Block is surpassed by a candle formed subsequently, which closes above that maximum.
A Bearish Order Block is the highest candle that has a bullish close, which presents the largest body (that is, the distance between the open and close), and is near a Resistance level. The pattern will be confirmed when the minimum of the candle forming the Order Block is breached by a candle formed subsequently, which closes below that minimum.
Graphically, you can see in the following chart what a Bullish Order Block looks like (the bearish case would be the inverse):

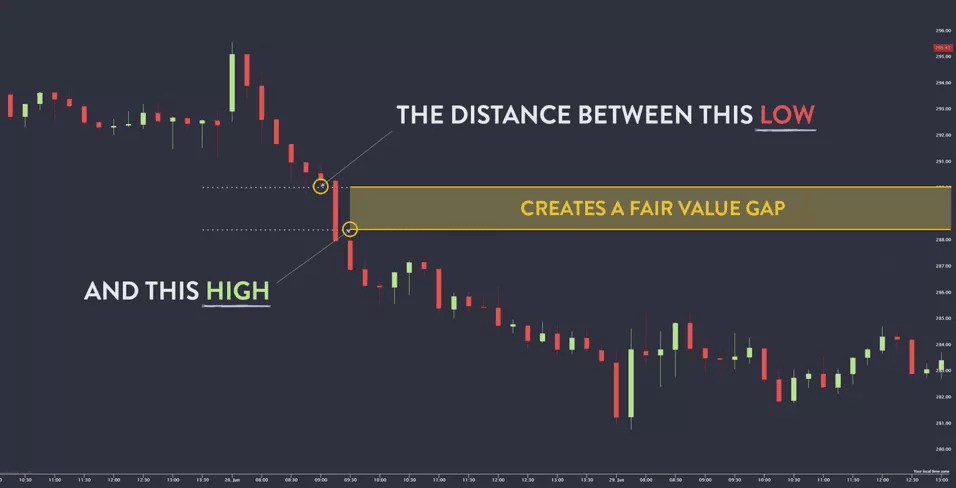
2. Imbalance / Fair Value Gap
The Imbalance or Fair Value Gap (FVG) pattern is a clear signal of market imbalance. To identify this pattern, it is enough to take sequences of three candles and look for wide-range candles that barely overlap with the upper and lower wicks of the adjacent candles. That is, there is a price range in that large candle that does not touch the range of the previous and subsequent candle, leaving a kind of gap called Fair Value Gap.
The size of that gap is obtained by measuring the distance between the maximum of the previous candle and the minimum of the subsequent one (bullish case), or the minimum of the previous candle and the maximum of the subsequent one (bearish case).
In the following chart, you can see schematically explained what an FVG looks like within a bearish movement:
3. Mitigation Block
In this case, we are facing market failure structures, where the price fails to surpass a previously established maximum or minimum. In particular:
Bearish Mitigation Blocks form when the market creates a short-term resistance, then the price turns marking a low and subsequently turns again upwards but fails to surpass the established highs, forming a new high below the resistance. Finally, the market breaks below the intermediate low, closing below that level. The candle that closes below that low is referred to as a Bearish Mitigation Block.
In the case of Bullish Mitigation Blocks, the market marks a short-term support; then the price turns marking a high and subsequently drops again but fails to break the established lows, forming a new low above the resistance. Finally, the market breaks upwards the intermediate high, closing above that level. The candle that closes above that high is referred to as a Bullish Mitigation Block.
Graphically, you can see a Bearish Mitigation Block schematically in the following figure:

4. Liquidity Voids
This term, which we can translate as "liquidity voids," refers to explosive movements, generally wide and without pauses in a single direction, that occur after a consolidation, and as a consequence of the lack of liquidity for a certain direction.
Such wide-ranging movements are often "filled" later, with the price making a reverse move that sometimes even manages to reach the order block prior to the explosive movement.
In the following chart, you can see an example of a Liquidity Void in a bullish context:

In the next installment, we will continue examining some more concepts, to later start working on strategies based on this type of patterns.