The Connors Double 7 Strategy
Possibly less known than the famous RSI2 strategy, Double 7 is as simple as it is effective. Published in the legendary Short Term Trading Strategies That Work written by Larry Connors along with César Álvarez, the strategy is designed to be applied to the main market indices through ETFs, although futures can also be used.
Rules of the Strategy
As we discussed, the rules are extremely simple, here they are:
The asset we are trading must be above its 200-day moving average.
If the asset closes marking a minimum of the last 7 days, we will buy.
If we have an open long position and the asset closes marking a maximum of 7 days, we will close the position.
This would apply to the long side, but if you want to trade the strategy from the short side, the rules will logically be the inverse:
The asset we are trading must be below its 200-day moving average.
If the asset closes marking a maximum of the last 7 days, we will buy.
If we have an open short position and the asset closes marking a minimum of 7 days, we will close the position.
As you can see, the idea is not very different from that underlying the RSI2. It is, ultimately, about riding the prevailing trend when a significant correction occurs. On the other hand, it is worth noting that the strategy initially does not have stops, so if we are considering trading it, we should be prepared for some surprises until the exit condition is met.
Let's see an example of how the strategy works in practice. As you can see in the following SPY chart, the ETF on the S&P 500, we will see that on February 21, 2023, it marked the minimums of the last 7 days, so a purchase is activated at the opening on February 22. Subsequently, on Friday, March 3, the market closes at a 7-day maximum, so the operation is closed at the opening on Monday the 6th.
Example Double Seven SPY
How Well Does the Strategy Work?
Now that we know what its rules are, let's see if this strategy continues to work, testing it on multiple ETFs. In particular, we will test it using the complete historical data of DIA, EEM, EFA, EWH, EWJ, EWT, EWZ, FXI, GLD, ILF, IWM, IYR, QQQ, SPY, XHB, XLB, XLE, XLF, XLI, and XLV.
I performed the backtest using the Double 7’s Strategy script that you can find on TradingView. Starting with a capital of $10,000 and not applying commissions, the result obtained with this strategy considering the long side only would be as follows:
Double 7 - Only Longs
As we can see, the performance is quite acceptable, especially in the case of SPY, EWT, QQQ, and XHB.
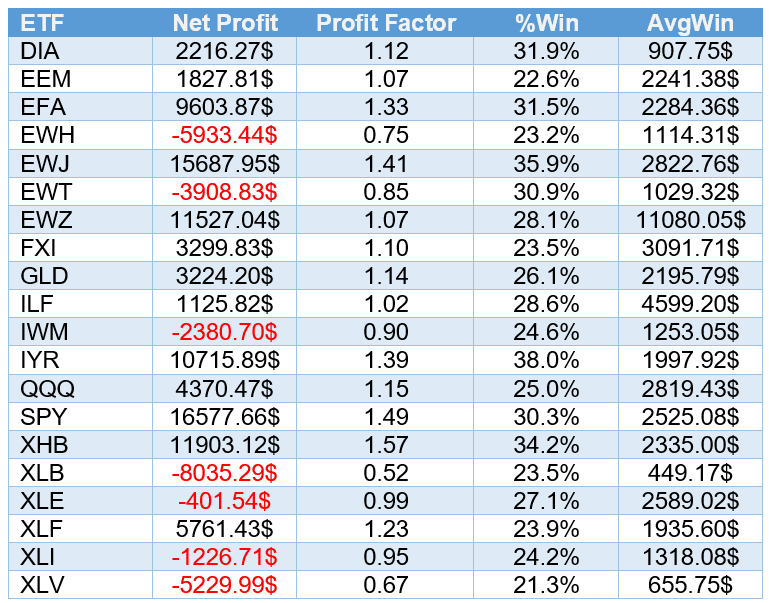
However, if we add operations from the short side, the results deteriorate significantly, as we can see in the following table:
Double 7 - Longs and Shorts
In the results obtained by incorporating the short side of the strategy, two things stand out in particular:
On one hand, the sharp drop in the hit rate (%Win) in all ETFs;
And, on the other hand, there is a huge increase in the average profit per trade (AvgWin) generally, which could indicate that many of the positive results obtained are masked by a few trades with strong gains.
For all these reasons, we can conclude that the Double 7 strategy is suitable only for being traded on the long side.
Conclusion
As I mentioned in my 2020 Robotrader talk on Classic Trading Strategies, the RSI2 strategy continued to work. And the same seems to apply to the Double 7 strategy, based on the results we have seen in this article, as long as we trade the long side.
It is worth remembering that the book by Connors and Álvarez was published no less than... in 2009! That is to say, strategies created at the beginning of the 21st century continue to work more than 10 years after they were published. Certainly, there are not many strategies that can be said to have that.
For all these reasons, I personally believe that working with these swing-type strategies to start composing portfolios of stocks and ETFs seems like an excellent idea. Likewise, for those who are just starting in the markets, I think that both RSI2 and Double 7 are undoubtedly a very recommendable starting point to begin creating new strategies based on them.
Ah, and if you are interested in seeing a thorough analysis of the results obtained by applying this strategy in currency pairs, I recommend that you take a look at the article Systematic Trading of Mean Reversion.
As we discussed, the rules are extremely simple, here they are:
The asset we are trading must be above its 200-day moving average.
If the asset closes marking a minimum of the last 7 days, we will buy.
If we have an open long position and the asset closes marking a maximum of 7 days, we will close the position.
This would apply to the long side, but if you want to trade the strategy from the short side, the rules will logically be the inverse:
The asset we are trading must be below its 200-day moving average.
If the asset closes marking a maximum of the last 7 days, we will buy.
If we have an open short position and the asset closes marking a minimum of 7 days, we will close the position.
As you can see, the idea is not very different from that underlying the RSI2. It is, ultimately, about riding the prevailing trend when a significant correction occurs. On the other hand, it is worth noting that the strategy initially does not have stops, so if we are considering trading it, we should be prepared for some surprises until the exit condition is met.
Let's see an example of how the strategy works in practice. As you can see in the following SPY chart, the ETF on the S&P 500, we will see that on February 21, 2023, it marked the minimums of the last 7 days, so a purchase is activated at the opening on February 22. Subsequently, on Friday, March 3, the market closes at a 7-day maximum, so the operation is closed at the opening on Monday the 6th.

How Well Does the Strategy Work?
Now that we know what its rules are, let's see if this strategy continues to work, testing it on multiple ETFs. In particular, we will test it using the complete historical data of DIA, EEM, EFA, EWH, EWJ, EWT, EWZ, FXI, GLD, ILF, IWM, IYR, QQQ, SPY, XHB, XLB, XLE, XLF, XLI, and XLV.
I performed the backtest using the Double 7’s Strategy script that you can find on TradingView. Starting with a capital of $10,000 and not applying commissions, the result obtained with this strategy considering the long side only would be as follows:
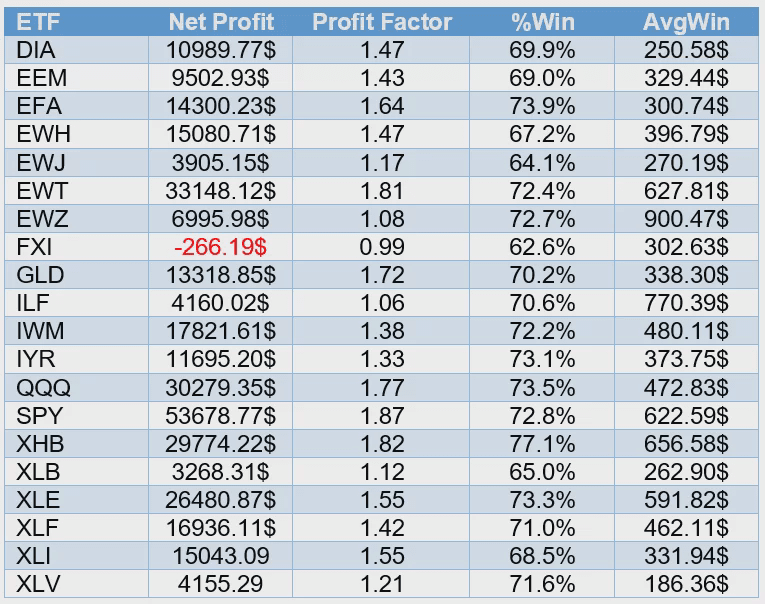
As we can see, the performance is quite acceptable, especially in the case of SPY, EWT, QQQ, and XHB.
However, if we add operations from the short side, the results deteriorate significantly, as we can see in the following table:
In the results obtained by incorporating the short side of the strategy, two things stand out in particular:
On one hand, the sharp drop in the hit rate (%Win) in all ETFs;
And, on the other hand, there is a huge increase in the average profit per trade (AvgWin) generally, which could indicate that many of the positive results obtained are masked by a few trades with strong gains.
For all these reasons, we can conclude that the Double 7 strategy is suitable only for being traded on the long side.
Conclusion
As I mentioned in my 2020 Robotrader talk on Classic Trading Strategies, the RSI2 strategy continued to work. And the same seems to apply to the Double 7 strategy, based on the results we have seen in this article, as long as we trade the long side.
It is worth remembering that the book by Connors and Álvarez was published no less than... in 2009! That is to say, strategies created at the beginning of the 21st century continue to work more than 10 years after they were published. Certainly, there are not many strategies that can be said to have that.
For all these reasons, I personally believe that working with these swing-type strategies to start composing portfolios of stocks and ETFs seems like an excellent idea. Likewise, for those who are just starting in the markets, I think that both RSI2 and Double 7 are undoubtedly a very recommendable starting point to begin creating new strategies based on them.
Ah, and if you are interested in seeing a thorough analysis of the results obtained by applying this strategy in currency pairs, I recommend that you take a look at the article Systematic Trading of Mean Reversion.