I have been trading cryptocurrencies for 10 years, suffered for 5 years, all because I realized one thing: it is easy to achieve several tens of millions in assets and support my family through trading!
Trading cryptocurrencies is simply a repetitive process. When you reach the peak, you will have an epiphany. Today, I will unreservedly share the trend charts of trading, hoping to help those climbing the mountain below understand the truth and essence of trading!

As the old saying goes, 'No one gets rich without unexpected wealth, and horses don't get fat without night grass.' I believe many people entered the crypto space with the initial intention of making a big profit and then reaching the peak of life, but due to a lack of the correct method, things went awry, and in the end, they lost both money and soldiers. Hence, many began a journey of learning, such as buying books, researching materials, or seeking guidance from experienced individuals.
1. Trading Advancement: From novice to master.
In trading, transitioning from the ordinary to the extraordinary requires a deep transformation in mindset and attitude; the following six elements are key.
Probability Thinking: Accept losses, build a foundation for compound interest.
In trading, losses are the 'entry fee'; normalizing single trade gains and losses.
One should not get entangled in single gains or losses, but rather focus on the long term, building a compound interest engine. Each trade is a probability game, relying on reasonable strategies and probability grasp to achieve asset growth.
2. Anti-Fragile Mindset: Abandon fantasies of sudden wealth, refrain from gambling-type operations.
The fantasy of sudden wealth is like a tumor; operations such as averaging down on floating losses or adding to profits must be eliminated. Cultivate an anti-fragile mindset, calmly and rationally face fluctuations, make objective analyses, and decisions without being misled by short-term interests.
3. Sniper Discipline: Adhere to signal thresholds, wait for the best timing.
The market is ever-changing; excellent traders are like snipers, strictly adhering to signal thresholds. 90% of the time, they preserve their strength, decisively act when signals arise without being disturbed by short-term fluctuations, and adhere to rhythm principles.
Emotional Insulator: Mechanical stop-loss, separating from emotional interference.
Emotional fluctuations can easily lead to trading failures. One must become an emotional insulator; stop-loss decisions must be as decisive as turning off a light. Account fluctuations should not disturb the mind, and decisions should be based on reason and rules, not swayed by fear or greed, ensuring stable trading.
Five, Third-Person Perspective Decision-Making: Remove subjective assumptions and objectively analyze the market.
In trading decisions, detach subjectivity and objectively analyze the bull-bear game from a third-party perspective like AI to enhance noise-filtering efficiency, not being bound by biased emotions, and make reasonable decisions based on the market's reality.
6. System Believer: Faithfully follow the trading system to achieve precise execution.
Trading rules that have undergone thousands of backtests are like a compass. Once an effective system is established, it must be faithfully followed and executed precisely. Do not arbitrarily change rules or rely on feelings; leverage the system's advantages to achieve stable profits. When these six points sink into the soul, trading transcends into a ritual of converting cognition into reality. No longer argue with the market, but tame instincts with rules.
Do not predict rises and falls; create a risk ark; profit and loss data forms a river of compound interest. Stable profits are not achieved through technical victories but by training human weaknesses into a program's discipline.
Super simple and effective trading methods.
The fifteen K-line patterns with the highest success rates.
Below are fifteen K-line patterns widely recognized for their high success rates in technical analysis, along with key operational points, organized based on practical experience and classic theories:
1. Hammer Line and Hanging Man Line
Characteristics: Lower shadow ≥ 2 times body, no upper shadow (or very short), body positioned at the top of the price range.

Signal Meaning:
Hammer Line (End of Downtrend): Bullish reversal signal, high probability of bottom reversal.
Hanging Man Line (End of Uptrend): Bearish reversal signal, top reversal warning.
Confirmation Conditions: The next day's closing price must be above the hammer line's body or below the hanging man line's body.
Stop Loss Levels: Below the lowest point of the hammer line; above the highest point of the hanging man line.
Additionally, the inverted hammer at the bottom and the shooting star at the top have the same significance as the hammer line and hanging man line mentioned above.
2. Bullish/Bearish Engulfing Patterns

Characteristics: The second K-line's body completely covers the previous K-line's body, and the colors are opposite.
Signal Meaning:
Bullish Engulfing: At the end of a downtrend, a strong bullish reversal.
Bearish Engulfing: At the end of an uptrend, a strong bearish reversal.
Key Details: The engulfing K-line's trading volume must increase, raising the success rate by over 30%.
Operational Suggestions
Bullish Engulfing: Enter when the closing price of the bullish candle breaks above the previous high, set stop loss at the lowest point of the bullish candle.
Bearish Engulfing: When the closing price of the bearish candle breaks below the previous low, exit or short, set stop loss at the highest point of the bearish candle.
3. Morning Star and Evening Star
Characteristics: A combination of three K-lines, with the middle one being a small body (doji or spinning top).
Morning Star: At the end of a downtrend, composed of a large bearish candle followed by a doji/star or small body and then a large bullish candle. The third bullish candle must cover more than 50% of the first bearish candle (bottom reversal).

Evening Star: At the end of an uptrend, composed of a large bullish candle followed by a doji/star or small body and then a large bearish candle. The third bearish candle must cover more than 50% of the first bullish candle (top reversal).

Trading Strategy:
Morning Star: Buy when the bullish candle breaks above the high of the bearish candle, set stop loss at the low of the doji.
Evening Star: Short when the bearish candle breaks below the low of the bullish candle, set stop loss at the high of the doji.
Market Significance: Bearish/Bullish exhaustion, bullish/bearish reversal signals.
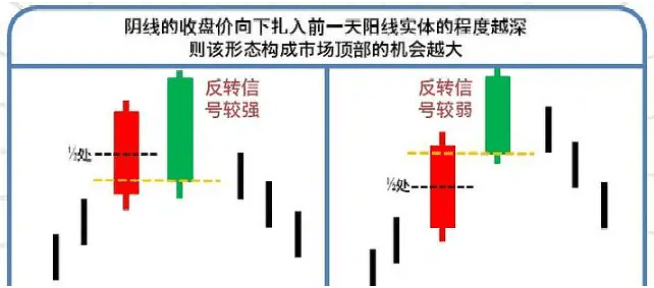
4. Pregnant Line

Characteristics: The previous candle's body completely engulfs the next candle's body, with opposite colors.
Signal Meaning: Trend momentum exhaustion, reversal warning (requires trend position judgment).
Enhanced Signal: If the second candle is a doji (doji pregnant line), the reversal probability is higher. The K-line on the right can also have upper and lower shadows, but the shorter the shadow, the more credible.
(Some also say that the same color can work, but what matters is the position rather than the color. A continuously rising market appearing pregnant line likely means short-term bullish strength exhaustion; a continuously falling market appearing pregnant line likely means bearish exhaustion).
5. Dark Cloud Cover and Piercing Line
Characteristics:
Dark Cloud Cover: After a large bullish candle in an uptrend, the next day opens high and closes low with a bearish candle, closing below the body of the previous bullish candle by more than 50%; Piercing Line: After a large bearish candle in a downtrend, the next day opens low and closes high with a bullish candle, closing above the body of the previous bearish candle by more than 50%.
Win Rate Statistics: When at key resistance/support points, success rates exceed 65%. The longer the K-line's body and the shorter the shadow, the stronger the signal for a top reversal.
6. Three Crows and Three Soldiers Pattern

Holding Characteristics: Three consecutive same-direction medium-long body K-lines, closing prices successively hitting new lows/new highs.
Three Crows: Three consecutive bearish candles at the top, a crushing decline by bears.
Three Soldiers Pattern: Three consecutive bullish candles at the bottom, strong bullish breakout.
Signal Meaning: The appearance of three crows in a high price area indicates that selling pressure at the top is very heavy, and each time the bulls open high, they are pressed down by the bears, and have lost upward momentum.
Note: Be wary of evolving into 'false breakout traps' in a volatile market.
The dark cloud cover must precede a continuous uptrend and end with a bullish candle, followed by three consecutive bearish candles, accompanied by significant volume rather than a reduction in volume. Personally, I feel this pattern is hard to judge, and its accuracy needs verification. Both three consecutive bearish and bullish candles are difficult; continuing is even harder.
Head and Shoulders Top/Bottom


Pattern Characteristics:
Head and Shoulders Top: Left shoulder - higher, head - higher, right shoulder (decreasing volume) confirms reversal upon breaking the neck line.
Inverted Head and Shoulders: Left shoulder - lower, head - higher, right shoulder (increasing volume) confirms reversal upon breaking the neck line.
Quantitative Rules:
After breaking below the neck line, the target decline is the vertical distance from the head to the neck line.
Volume significantly shrinks when forming the right shoulder.
Statistical Advantage: The success rate of patterns in large cycles (weekly/monthly) exceeds 70%.
8. Ascending Channel and Descending Three Methods

Characteristics: In an uptrend, a large bullish candle is followed by 3-5 small K-lines (pullback does not break the low of the bullish candle), eventually breaking through the previous high with a large bullish candle. Essence: A brief pause in the trend, building strength before continuing in the direction.
Entry Point: Increase positions when the 5th-8th bullish candles break through, set stop loss outside the consolidation range.
9. Island Reversal


Characteristics: Price gaps form an 'island'; subsequently, a reverse gap closes the gap.
Scarcity: Rarely appears, but once established, the reversal strength is extremely strong.
Case Study: The 'Pandemic Bottom Island Reversal' that occurred after the U.S. stock market plummeted in March 2020.
10. Doji and Gravestone Doji

Doji: Opening price = closing price, bulls and bears are evenly matched, a warning for trend reversal.
Gravestone Doji: A long upper shadow doji, often found at the top, indicating a failure of the bulls.
Combine with Indicators: If the doji appears in the RSI overbought/oversold zone, the signal is strengthened.
11. Double Tops and Double Bottoms
Double Top, which we are familiar with as 'M' shape, while Double Bottom is often referred to as 'W' shape. Due to the price presenting a zigzag pattern, these patterns often appear in reversals, and most double bottoms or double tops frequently form a densely packed pattern, making it difficult to identify at such times. To avoid misjudging the formation position of double tops or double bottoms during operations, investors should wait until a significant ratio appears, i.e., when there is significant change, and the price reverses in the opposite direction before making judgments. Unfortunately, when the above scenario has occurred, investors often miss out on great profit opportunities.
Basic double tops and double bottoms patterns as shown in Figure 1-1.

12. Gradual Widening
Widening type usually forms due to a prolonged or highly active period of certain futures prices; often after a breakout, the peaks rise successively, and the lows also successively become lower until the market finally changes trend in one direction. This type of formation consists of a series of waves, generally requiring at least three complete waves. The development of the subsequent market, such as the direction the market price will take, is relatively difficult to predict. Figure 1-2 shows two types of widening patterns, 1-2.

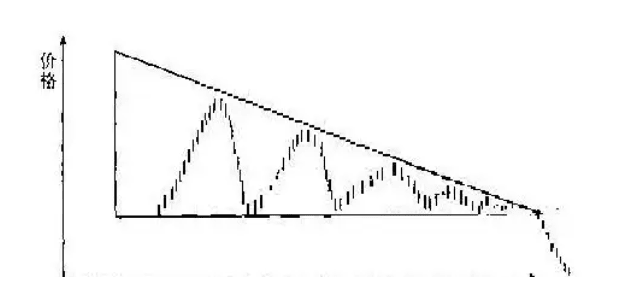
13. Triangle
This pattern is easy to identify; it has three types: symmetrical triangle, ascending triangle, and descending triangle. A symmetrical triangle, as the name suggests, has both sides equal and symmetrical, indicating that the price peaks are moving down while the lows are moving up. This pattern in the futures market indicates that the market is quite stable, and its long-term trend will continue unchanged.

Generally speaking, triangles are often seen by futures traders as a consolidation period for the market, usually lasting about two to three weeks. Technical operators have little confidence in triangles; both ascending and descending triangles are covered by resistance and support lines, with ascending triangles heralding a bullish market and descending triangles indicating investors are bearish on the future market.
1-4 Ascending Triangle

1-5 Descending Triangle
14. Box and Rectangle
Boxes and rectangles are two credible continuous chart patterns. The main difference between these two patterns is that the latter has a longer change cycle and a larger price change interval.
1-6

1-7

15. Flags
Flags also come in two types: ascending flag and descending flag; the former indicates a bullish market, while the latter indicates a bearish market. In flags, the peaks and troughs of prices move parallel in the same direction, while the flag's direction moves opposite to the price trend. Flags typically last around four to five days, and trading volume decreases significantly. Generally, it appears halfway through a bullish or bearish market; sometimes, such adjustments may exceed the original bullish or bearish market's rise or fall by 30% to 50%. Flags are quite reliable patterns. After the appearance of the pattern, the price will continue to move in its long-term direction, and over 50% of technical adjustments should be viewed as the basic trend having changed direction, as shown in Figures 1-8 and 19.
1-8 Ascending Flag

Four Core Principles to Improve Win Rates
1. Position > Pattern: The effectiveness of the same pattern at support/resistance levels is far greater than randomly appearing patterns. All patterns need to be combined with the trend background (for example, the hammer line is effective at the end of a downtrend, while in an uptrend, it may fail).
2. Multi-period Verification: Daily line patterns need to be matched with weekly trend (e.g., weekly uptrend + daily hammer line).
3. Volume Verification: Reversal patterns require volume confirmation, consolidation patterns need reduced volume (e.g., bullish engulfing on volume, right shoulder on head and shoulders breaking out with volume).
4. Stop-Loss Discipline: Even high win-rate patterns can fail; strict stop loss is the core of long-term profitability.
Data Reference: According to backtest statistics, combined with volume-price and trend K-line patterns (such as engulfing + volume), the practical win rate can reach 55%-65%. Purely pattern naked K trading has a win rate of only 40%-50%, so it is recommended to pair with indicators like divergence and Bollinger Band contraction to filter noise.
3. Create content from experiences, investment strategies, risk reminders, etc.

Years of ups and downs in the crypto space, I will fully disclose my practical insights.
Entering the crypto space, it has already been several years. I still remember when I first arrived, I was just a small retail investor with a few tens of thousands of yuan in capital, full of curiosity and longing for this field filled with opportunities and risks. After years of ups and downs in the crypto space, experiencing countless fluctuations, I have finally achieved a modest success, and today I will share my experience with everyone without reservation.
Capital management is crucial in trading cryptocurrencies; never invest all your funds at once. It is wise to operate in batches. I set strict loss stop lines for myself; once touched, I withdraw decisively without hesitation. Even if I encounter consecutive losses, I can ensure the safety of my capital. However, if I make a profit, the returns can be quite considerable. Even if unfortunately trapped, having funds to cushion allows me to maintain a stable mindset.
Going with the trend is key to standing firm in the crypto space. When the market is declining, attempting to precisely catch the bottom is often unrealistic and highly risky. However, when the market is rising and a pullback occurs, it is an excellent opportunity to buy low, much safer than blindly pursuing the bottom. Be vigilant in selecting coins; those that suddenly surge, whether mainstream or altcoins, must be treated cautiously. Their rapid rise can be matched by equally severe pullbacks, and a moment's inattention can lead to being trapped.
Technical analysis is also indispensable. The indicator I use most often is the MACD; when the DIF line and the DEA line cross below the zero axis and then successfully break through the zero axis, it is a strong buy signal. If they cross above the zero axis and then move down, it is time to reduce positions. At the same time, trading volume is also an important reference. When the price breaks out at a low level and the trading volume significantly increases, it may indicate that a big opportunity is coming. Moreover, replenishing positions must be done with caution; never blindly increase positions when in loss, as many people end up losing more and ultimately losing everything. Remember, only consider increasing positions when in profit.
Although there are many opportunities in trading, risks should not be underestimated. The above is just my personal experience; the market is unpredictable, and there are no absolute rules for success. One should not blindly follow trends. I hope my sharing can be helpful to everyone, and I wish everyone can gain something in the market.
Keep an eye on: JUP DEGO MANTA
#加密市场反弹 #巨鲸JamesWynn动态 #MichaelSaylor暗示增持BTC
