I was struggling with trading and taking losses. Then I learned this strategy and was never liquidated again.
Hello traders!
Let me tell you one thing honestly—since I learned this strategy, I've never faced a loss again. So today I have the solution for you. I’m going to reveal a secret formula that no one else will tell you.
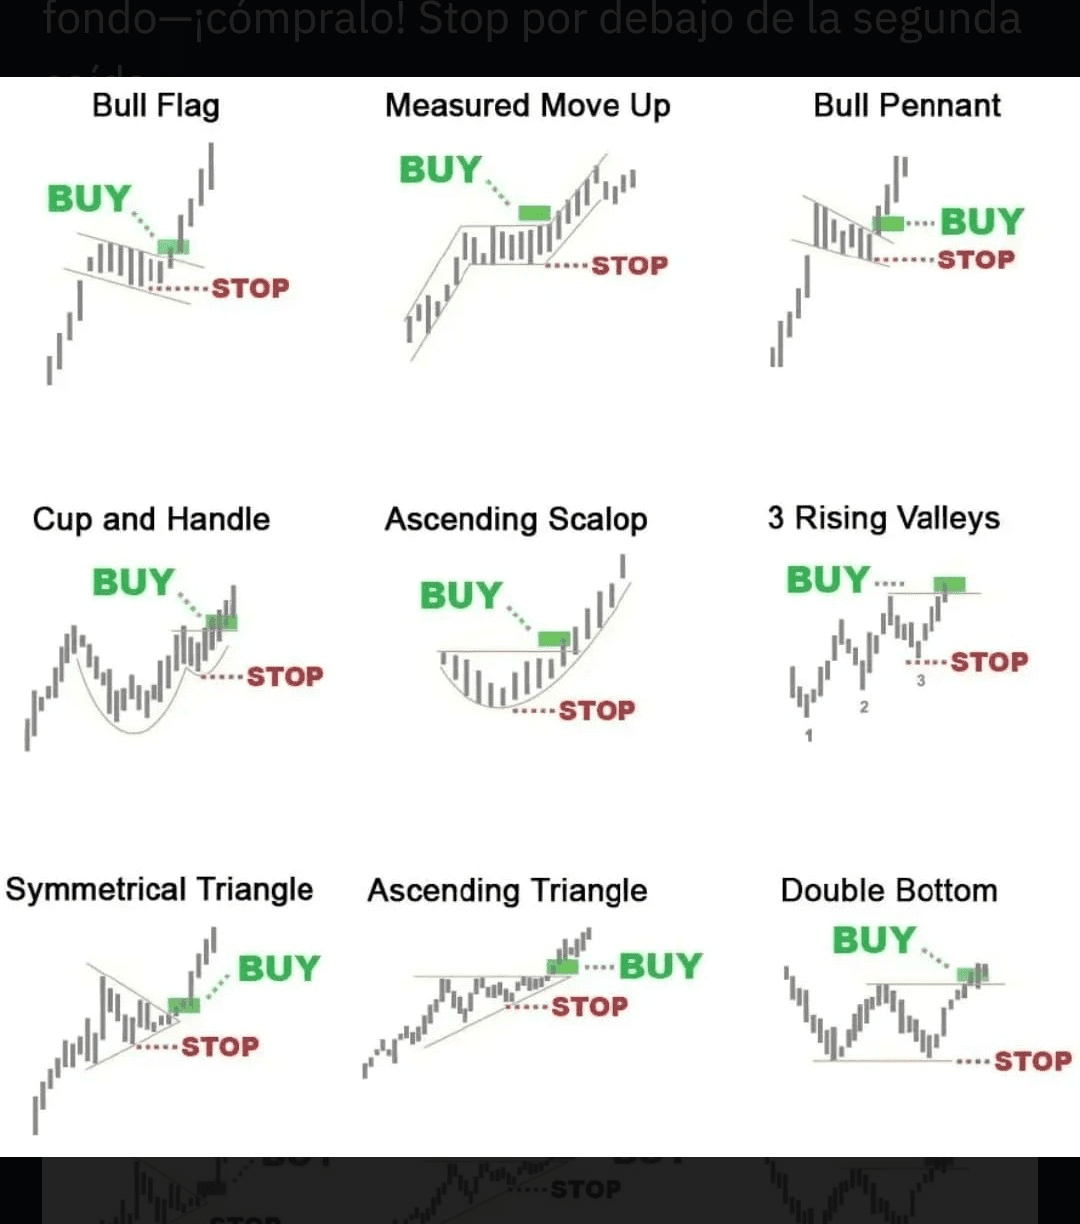
These patterns you see in the chart above? They are not just drawings—they are signals that generate money. Once you understand them, it's like unlocking a hidden language of the market. Let me explain it to you in the simplest way.
1. Bullish Flag 📈
After a strong upward movement, the price consolidates in a flag shape. When it breaks, that's your buy signal! The stop loss goes below the flag.
2. Measured Ascending Move 🔁
This is a wave pattern. After the first upward movement, wait for a correction. When it starts moving again—buy! Stop loss below the correction.
3. Bullish Flag 🚩
A short consolidation in a triangle after a rally. Breakout? That’s the time to enter. Place your stop just below the flag.
4. Cup and Handle ☕
It looks like a cup! When the price breaks above the handle, that's your green light to buy. The stop goes below the handle.
5. Ascending Shell 🌙
A beautiful curved shape that forms higher lows. Once the price breaks the curve, it's time to buy. Stop below the lowest point.
6. 3 Ascending Valleys ⛰️
Three drops, each higher than the previous one. Shows strong bullish power. Enter on the breakout above the third peak.
7. Symmetrical Triangle 🔺
The price is getting tighter and tighter, forming a triangle. When it breaks above—buy! The stop loss goes just below the triangle.
8. Ascending Triangle 📊
Flat top, rising bottom—super bullish. When the price breaks the upper line, buy! Stop loss below the trend line.
9. Double Bottom 🅱️
It's a 'W' shaped pattern. When the price breaks the neckline after the second bottom—buy it! Stop below the second drop.
Just buy with 10 USDT and sell at ten cents more and you will see the result for more
FOLLOW ME$WLD