At the time of writing, the price of SOL is trading at $180, with daily gains of 0.7%, weekly gains of 5.8%, and monthly gains of 18.9%.
The cryptocurrency market is beginning to surge strongly after Bitcoin's new all-time high. Bitcoin broke its own ceiling and reached $112,000, which has sparked enthusiasm throughout the crypto ecosystem.
What is driving the price of SOL?
On May 22, 2025, the price of Bitcoin reached a new all-time high. This strong momentum not only shook the market but also changed its overall direction. As a result, other cryptocurrencies like Solana began to show clear signs of sustained upward movement, which could mark the beginning of a new bullish phase.
However, SOL also has its own significant drivers, especially the growth in memecoin transactions on its network. Between April and May, the average daily volume of these cryptocurrencies increased by 46%.
So far in May, memecoins on Solana have already moved over $58.7 billion, exceeding the volume recorded in April by more than $1 billion.
Thus, the growth of the Solana ecosystem and BTC's rise to record levels create a favorable environment for new increases.
Additionally, there are macroeconomic factors favoring the crypto market, such as advances in trade agreements between the U.S. and China, declining inflation, and the fall of the U.S. dollar.

"Solana begins to outperform Bitcoin. That's what we want to see. BTC stable, Solana rising. SOL to $200 next! Remember my words."
Analysis of SOL charts: signals, resistances, and supports
The price of SOL remained firm above the $165 support in previous sessions, allowing it to initiate a new bullish momentum, in line with the behavior of Bitcoin and Ethereum.
Subsequently, it strongly surpassed the resistances of $170 and $172. Thanks to the increase in demand, the price also broke the $175 level, demonstrating growing interest from the market.

Analysis of SOL charts. Source: TradingView.
Resistances to watch:
$187: immediate resistance, although it remains a solid ceiling against the bullish advance.
$194: although the psychological level usually sits at $200, the true technical resistance is in this zone.
$209: major resistance, whose overcoming would be key to consolidating $200 as new support.
Supports to monitor:
$173: immediate support, corresponding to the daily low, from which SOL rebounded strongly.
$159: stronger support, identified as the low from May 19.
$150: relevant psychological support in case of losing the previous levels.
The RSI at 49.9 points indicates balance between buying and selling forces, with a slight bearish inclination, suggesting a possible consolidation phase in the short term.
Ali Martínez: breakout of the cup and handle pattern
Popular analyst Ali Martínez predicts that a breakout from the current levels could be the start of a significant bullish movement:
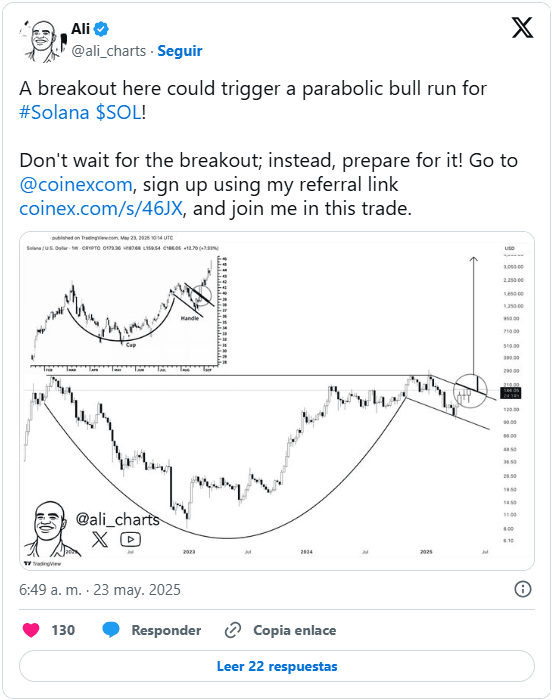
"A breakout here could trigger a parabolic bullish move for Solana!"
The main chart shows a classic technical pattern known as cup and handle, commonly interpreted as a bullish continuation signal.
The image also includes a horizontal resistance line (around $200), which the price is attempting to surpass.
Certainly, if the formation of this pattern is confirmed and a breakout occurs, it could generate significant upward momentum.