**🚨 $TRUMP /USDT Technical Breakdown — What Just Happened & What’s Next?**
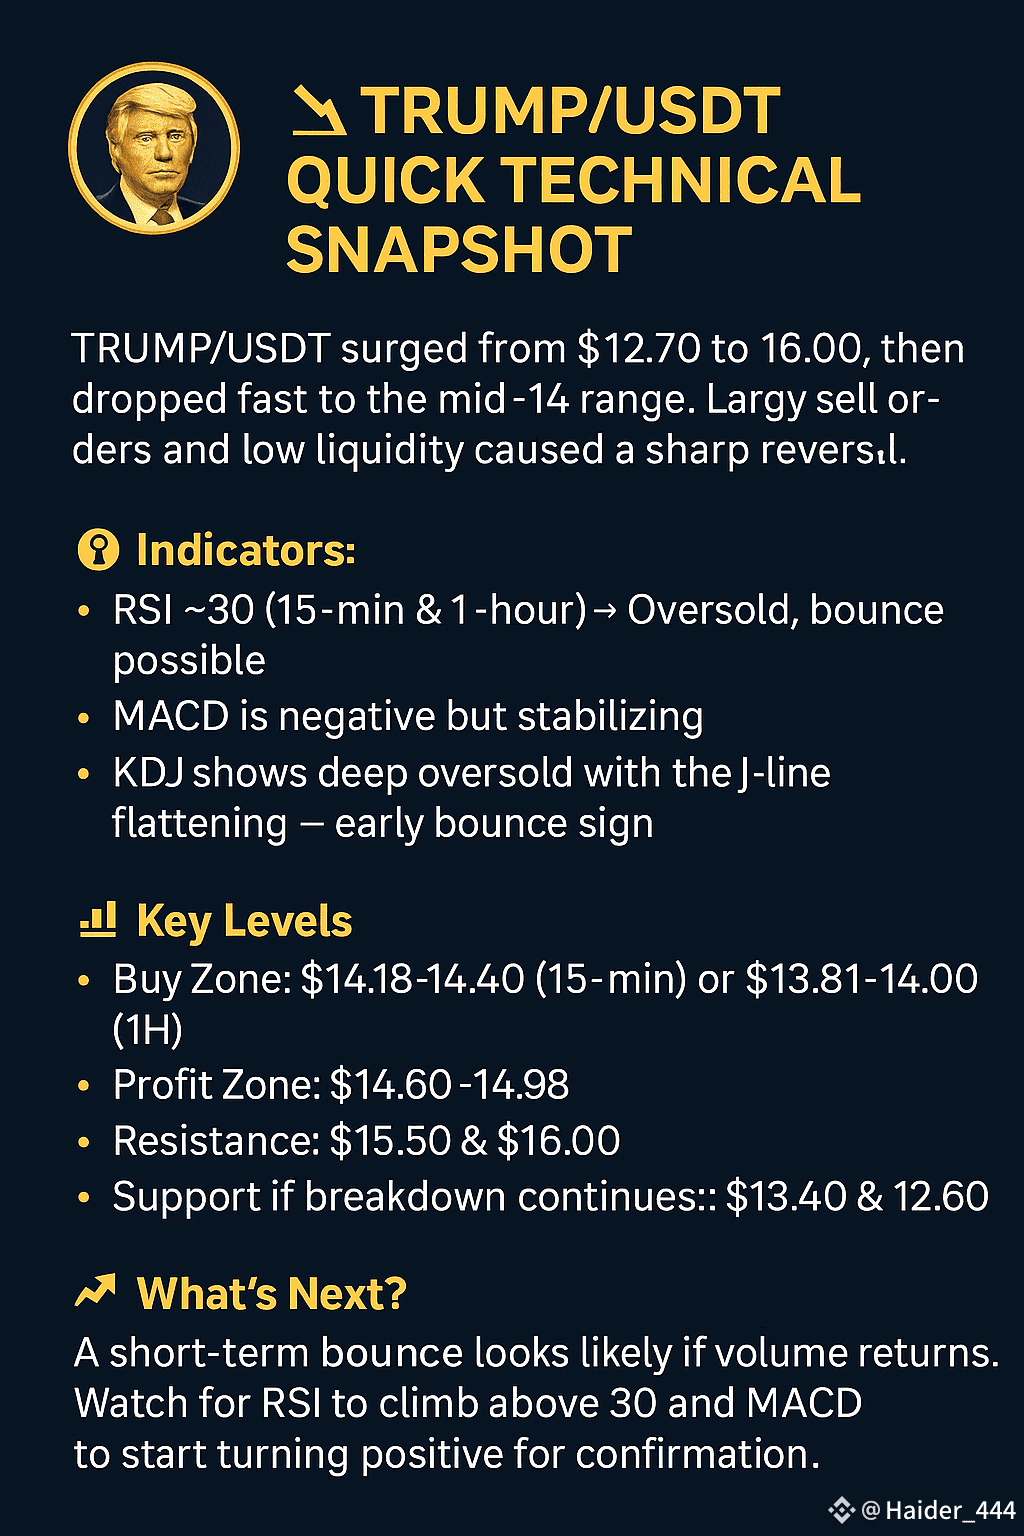
Let’s dive into what’s really going on with TRUMP/USDT. The pair pumped hard from around **\$12.70** to a 24-hour high near **\$16.00**, then dropped like a rock back into the mid-14s. Here’s the breakdown — what caused the move, where we’re headed next, and the key levels every trader should be watching.
---
### **📉 Price Action Snapshot**
TRUMP/USDT exploded upward thanks to a **tight Bollinger Band squeeze**, strong momentum, and heavy buys. But as soon as price touched the upper band around **\$16.00**, **profit-taking kicked in**, triggering large sell orders and cascading stop-losses. That drop — in thin overnight liquidity — created a classic waterfall move right down to the lower Bollinger Band.
---
### **🔍 Indicator Check (15-min & 1-hour)**
* **RSI (6)** on both timeframes is hovering around **30**, putting us in **oversold territory** — often a bounce zone.
* **MACD** is under zero with a **negative histogram**, confirming legit downside momentum — but that histogram is **starting to shrink**, signaling that the worst might be over.
* **KDJ** shows all lines in oversold zones, with the **J line flattening** — a classic early bounce signal, especially if volume starts to rise.
---
### **📊 Bollinger Bands & Volume**
**15-Min Bands:**
* Upper: **14.61**
* Middle: **14.40**
* Lower: **14.18**
**1-Hour Bands:**
* Upper: **16.15**
* Middle: **14.98**
* Lower: **13.81**
Price is hugging the **lower band** in both views — a typical mean-reversion zone. Volume spiked **2–3x normal** during the sell-off (likely capitulation), and now it’s tapering off — a sign sellers might be finished.
---
### **🔮 What’s Next for TRUMP/USDT?**
In the short term (next few 15-min candles), expect a bounce toward the middle band around **14.40–14.45**. If buyers hold that line with some volume, we could push toward **14.60–14.65** and maybe even retest **15.00**.
On the 1-hour chart, look for a move back toward **14.98**. But if bulls can’t hold that, a drop to the lower band at **13.81** is back on the table. If that fails, next support zones are **13.40** and **12.60**.
---
### **✅ High-Probability Buy Zone**
Watch for price to land in the **14.18–14.40** zone (15-min) or **13.81–14.00** (1-hour). Ideal entries show:
* A **green candle with a lower wick** bouncing off the lower band
* **RSI reclaiming 30**
* **KDJ J line** turning up and crossing K & D
* A **recovering MACD histogram**
Set a stop-loss below **13.60** for protection.
---
### **💰 Take Profit & Sell Zone**
Already long? Take partial profits near **14.40–14.65** (15-min). If we break **14.98** (hourly middle band), eyes on **15.50** and the **previous high at 16.00**.
Thinking of shorting? Wait for:
* A **clear red reversal candle** at 14.60–15.00
* **RSI dropping** from overbought
* A **bearish MACD crossover**
* A **volume spike on the rejection**
---
### **⚠️ Why the Drop Was So Violent**
It wasn’t random. Price hit resistance at the upper band, then stop-losses triggered around **15.50**. Add thin liquidity and algorithmic liquidations, and boom — you’ve got a sharp drop straight to support. Big hands likely bought that dip.
---
### **📌 Key Levels to Watch**
* **Buy Support Zones:**
* 14.18–14.40 (15-min)
* 13.81–14.00 (1-hour)
* **Profit Targets:**
* 14.40–14.65 (15-min)
* 14.98 (1-hour)
* 15.50, 16.00 (if momentum continues)
* **Breakdown Levels:**
* 13.40 and 12.60 (if lower bands break)
---
**Final Tip:** Keep a close eye on **how price reacts to Bollinger Bands**, and use **RSI**, **KDJ**, and **MACD** confirmations for clean entries and exits. Smart entries + disciplined exits = edge.
**/$TRUMP
---