How to trade using the Relative Strength Index - RSI Indicator, highlighting why traders use this indicator, what the RSI indicator is, and what its best settings for trading are, as well as looking into topics such as RSI trend lines and RSI period divergence.

What is the RSI?
The RSI measures the ratio of upward movements to downward movements, and the calculation is scaled so that the indicator is expressed in a range from 0-100. It was originally developed by J. Welles Wilder.
If the RSI value is 70 or higher, it is assumed that the financial instrument is in overbought territory (a condition in which prices have risen more than market expectations).
An RSI value of 30 or below is considered a signal that this instrument may be in oversold territory (a condition in which prices have fallen more than market expectations).
What is the RSI formula?
Contrary to popular belief, the RSI is a leading indicator. The RSI formula takes two common equations in solving the formula. The first component equation obtains the initial relative strength (RS) value, which is the ratio of the average 'Up' close to the average 'Down' close over the 'N' periods represented in the following formula:
RS = Average of 'N' days' higher closes / Average of 'N' days' lower closes
Or
RS = Average of 'N' day's closes up / Average of 'N' day's closes down
Calculate the average of the higher close sessions and divide the result by (number of days), then do the same process with the average of the lower close sessions and divide the result by (number of days), then divide the result of the average of the higher closes by the result of the average of the lower closes.
Then, the actual value of the RSI is calculated by indexing the indicator to 100, using the following formula:
Relative Strength Index = 100 - (100 / (1 + RS))
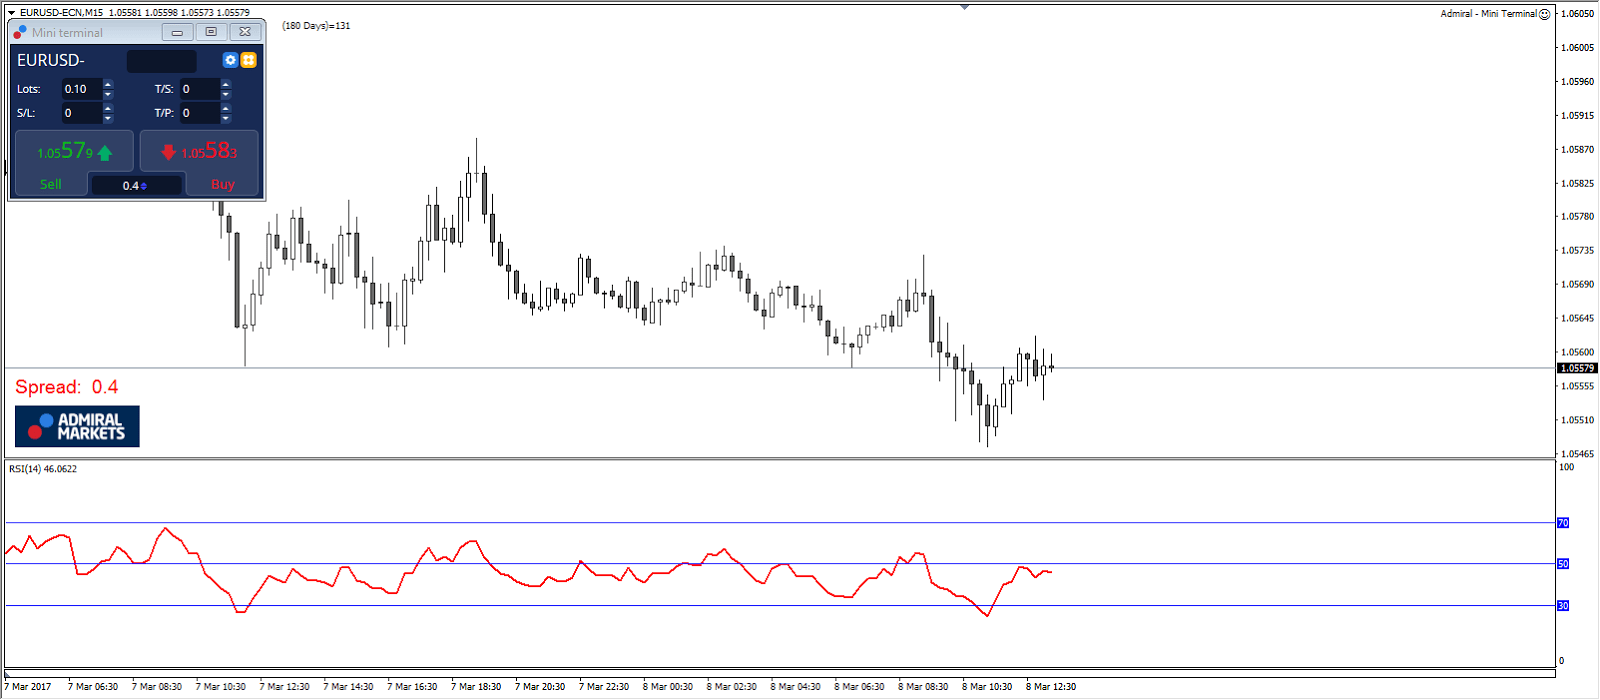
If you are using MetaTrader (MT4), you can attach the RSI indicator to your MT4 chart, simply drag and drop it into the main chart window. The image below illustrates this process:

Secrets of the RSI: What you need to know about the Relative Strength Index
Technical analysis is a method to predict future price movements and market trends by studying past market movement charts and comparing them to current drawings. Technical analysis is concerned with what has already happened in the market and what may happen. It considers the price of financial instruments and creates charts from that data to use as a foundational tool.
One of the main advantages of technical analysis is that experienced analysts are able to monitor many markets and market instruments simultaneously. There are three main principles in technical analysis that should be covered when taking a close look at the RSI - Relative Strength Index:
The trend is your friend
Technical analysis is used to identify patterns of market behavior that have long been recognized as significant. For many specific patterns, there is a high likelihood that they may lead to the expected outcomes. Additionally, there are also known patterns that repeat themselves on a consistent basis.
History repeats itself
Forex chart patterns have been identified and categorized for over 100 years, and the way many of these patterns repeat leads to the conclusion that human psychology has changed little over time.
Price movement reflects everything
This means that the actual price is a reflection of everything known to the market and can currently affect it, for example, supply and demand, political factors, and market tendencies. However, pure technical analysts only care about price movements, not the reasons for any changes that may occur. One of the indicators heavily relied upon by technical analysis is the RSI - Relative Strength Index. Trading the RSI has become increasingly popular due to its powerful equation and the possibility of using it with other technical indicators.
Best RSI Settings for Trading
You have now learned about the RSI indicator. But you need to know how to use the RSI effectively. It’s time to look at how to trade using the Relative Strength Index. Here are some examples of RSI settings to use in different trading strategies:
RSI Indicator Strategy: OBOS Levels
If the RSI is below 30, it means the market is in oversold territory, and the price may eventually rise. Once a reversal is confirmed, a buy trade can be placed. Conversely, if the RSI is above 70, it indicates that it is in overbought territory and the price may soon decline. After confirming the reversal, a sell trade can be placed. The level of 50 is the midpoint that separates the upper (bullish) regions from the lower (bearish) regions. In an uptrend, the RSI is usually above 50, while in a downtrend, it is below 50.
RSI Strategy: Divergence in Two Periods
Apply the short-term RSI (RSI 5) above the longer (default) RSI 14, and then observe the transitions. With the RSI 14, there are times when the market does not reach oversold or overbought levels before a changing trend occurs. The short-term RSI is more reactive to recent price changes, so it can show early signs of reversals. When the RSI 5 crosses above the RSI 14, it means that recent prices are rising.
A buy signal occurs when the crossover of 5 over 14 happens when the RSI 5 (blue) hits oversold (below 30). When the RSI 5 crosses down and becomes lower than the RSI 14, it indicates that the recent prices are declining. The crossover of RSI 5 over RSI 14 should happen when the 5-period (blue) is in the overbought area (above 80). Experienced traders may find that their trading performance greatly benefits from combining the RSI trading strategy with Pivot Points.

RSI Strategy: RSI Trend Lines
Connect the peaks and troughs on the RSI chart itself and trade the breakout of the trendline. To draw an upward RSI trend line, connect three or more points on the RSI line as it rises. A downward trend line is drawn by connecting three or more points on the declining RSI line. A breakout of the RSI trend line may indicate a potential continuation in prices or a reversal. Keep in mind that a breakout from the RSI trend line usually precedes a breakout from the price chart trend line, providing an early warning and a very early trading opportunity.

RSI: Classic Divergence
Bearish divergence in the RSI occurs when the price makes a new higher peak than the previous one, while the RSI decreases, forming a smaller peak. You will usually see RSI divergence forming at the top of a bullish market, which is known as a reversal pattern. Traders anticipate a reversal when divergence occurs in the RSI. It is a preliminary reversal warning, as it appears in several candles before the bullish trend changes direction and breaks below its support line.
Conversely, bullish divergence in the RSI occurs when the price makes a new lower low, while the RSI forms a higher low. This is a preliminary warning signal that the trend may change from a downward trend to an upward trend. RSI divergence is widely used in forex technical analysis. Some traders prefer to use higher time frames (4-hour or daily) for trading the RSI. With these optimal RSI settings, you can gain multiple buy and sell signals from the RSI.

RSI Indicator Strategy for Day Trading
We will now discuss how to use the RSI strategy for day trading. For many traders, using the RSI in day trading strategies is extremely beneficial. The default setting of the RSI indicator at 14 periods is suitable for most traders.
However, some day traders use different settings when using the RSI for day trading. They do not like to use the 14 setting, as they find it generates infrequent trading signals. As a result, some traders choose to lower their time frame, while others opt to slightly adjust the RSI period lower for increased sensitivity of the oscillator. Some traders deal with this issue by reducing their time frame. Others lower the RSI period setting to get a more sensitive oscillator.
In general:
Short-term traders (day traders) often use lower settings with periods in the range of 9-11.
Swing traders on the medium-term often use the default setting period, which is 14.
Long-term position traders often set it to a higher period, in the range of 20-30.
The settings to choose when using the RSI for day trading depend on your strategy.
Setting up the RSI Strategy for Day Trading
Choose the most effective settings for your trading style by determining how much noise you want to handle with the data you receive. Remember that regardless of the setting you choose, the more experience you gain with this indicator, the better you will become at identifying reliable signals.
In the case of using the RSI for day trading, you will be making short-term trades. Here, traders often choose lower settings for all variables because this provides earlier signals in this highly competitive environment. As mentioned above, short-term traders typically use lower settings with periods ranging from 9-11.
Summary of the RSI - Relative Strength Index
It is very easy to jump into trading using the Forex RSI, as beginner traders often start trading without testing different criteria or educating themselves on the correct interpretation of the indicator, due to the desire to make money quickly! As a result, the RSI has become one of the most widely misused indicators in MT4.
Once understood and applied correctly, the RSI has the potential to indicate whether prices are trending, when the market is in overbought or oversold territory, and the best price to enter or exit a trade.
