Bitcoin $BTC (BTC) is showing renewed bullish momentum as it approaches a potential golden cross — a key technical indicator where the 50-day moving average crosses above the 200-day average. Historically, this pattern has signaled strong upside potential for the world’s largest cryptocurrency.
This comes just weeks after Bitcoin pulled a classic "bear trap," luring in short sellers before launching a sharp rebound. Many traders who bet against BTC were left scrambling as the price surged unexpectedly, reinforcing the asset's reputation for shaking out weak hands.
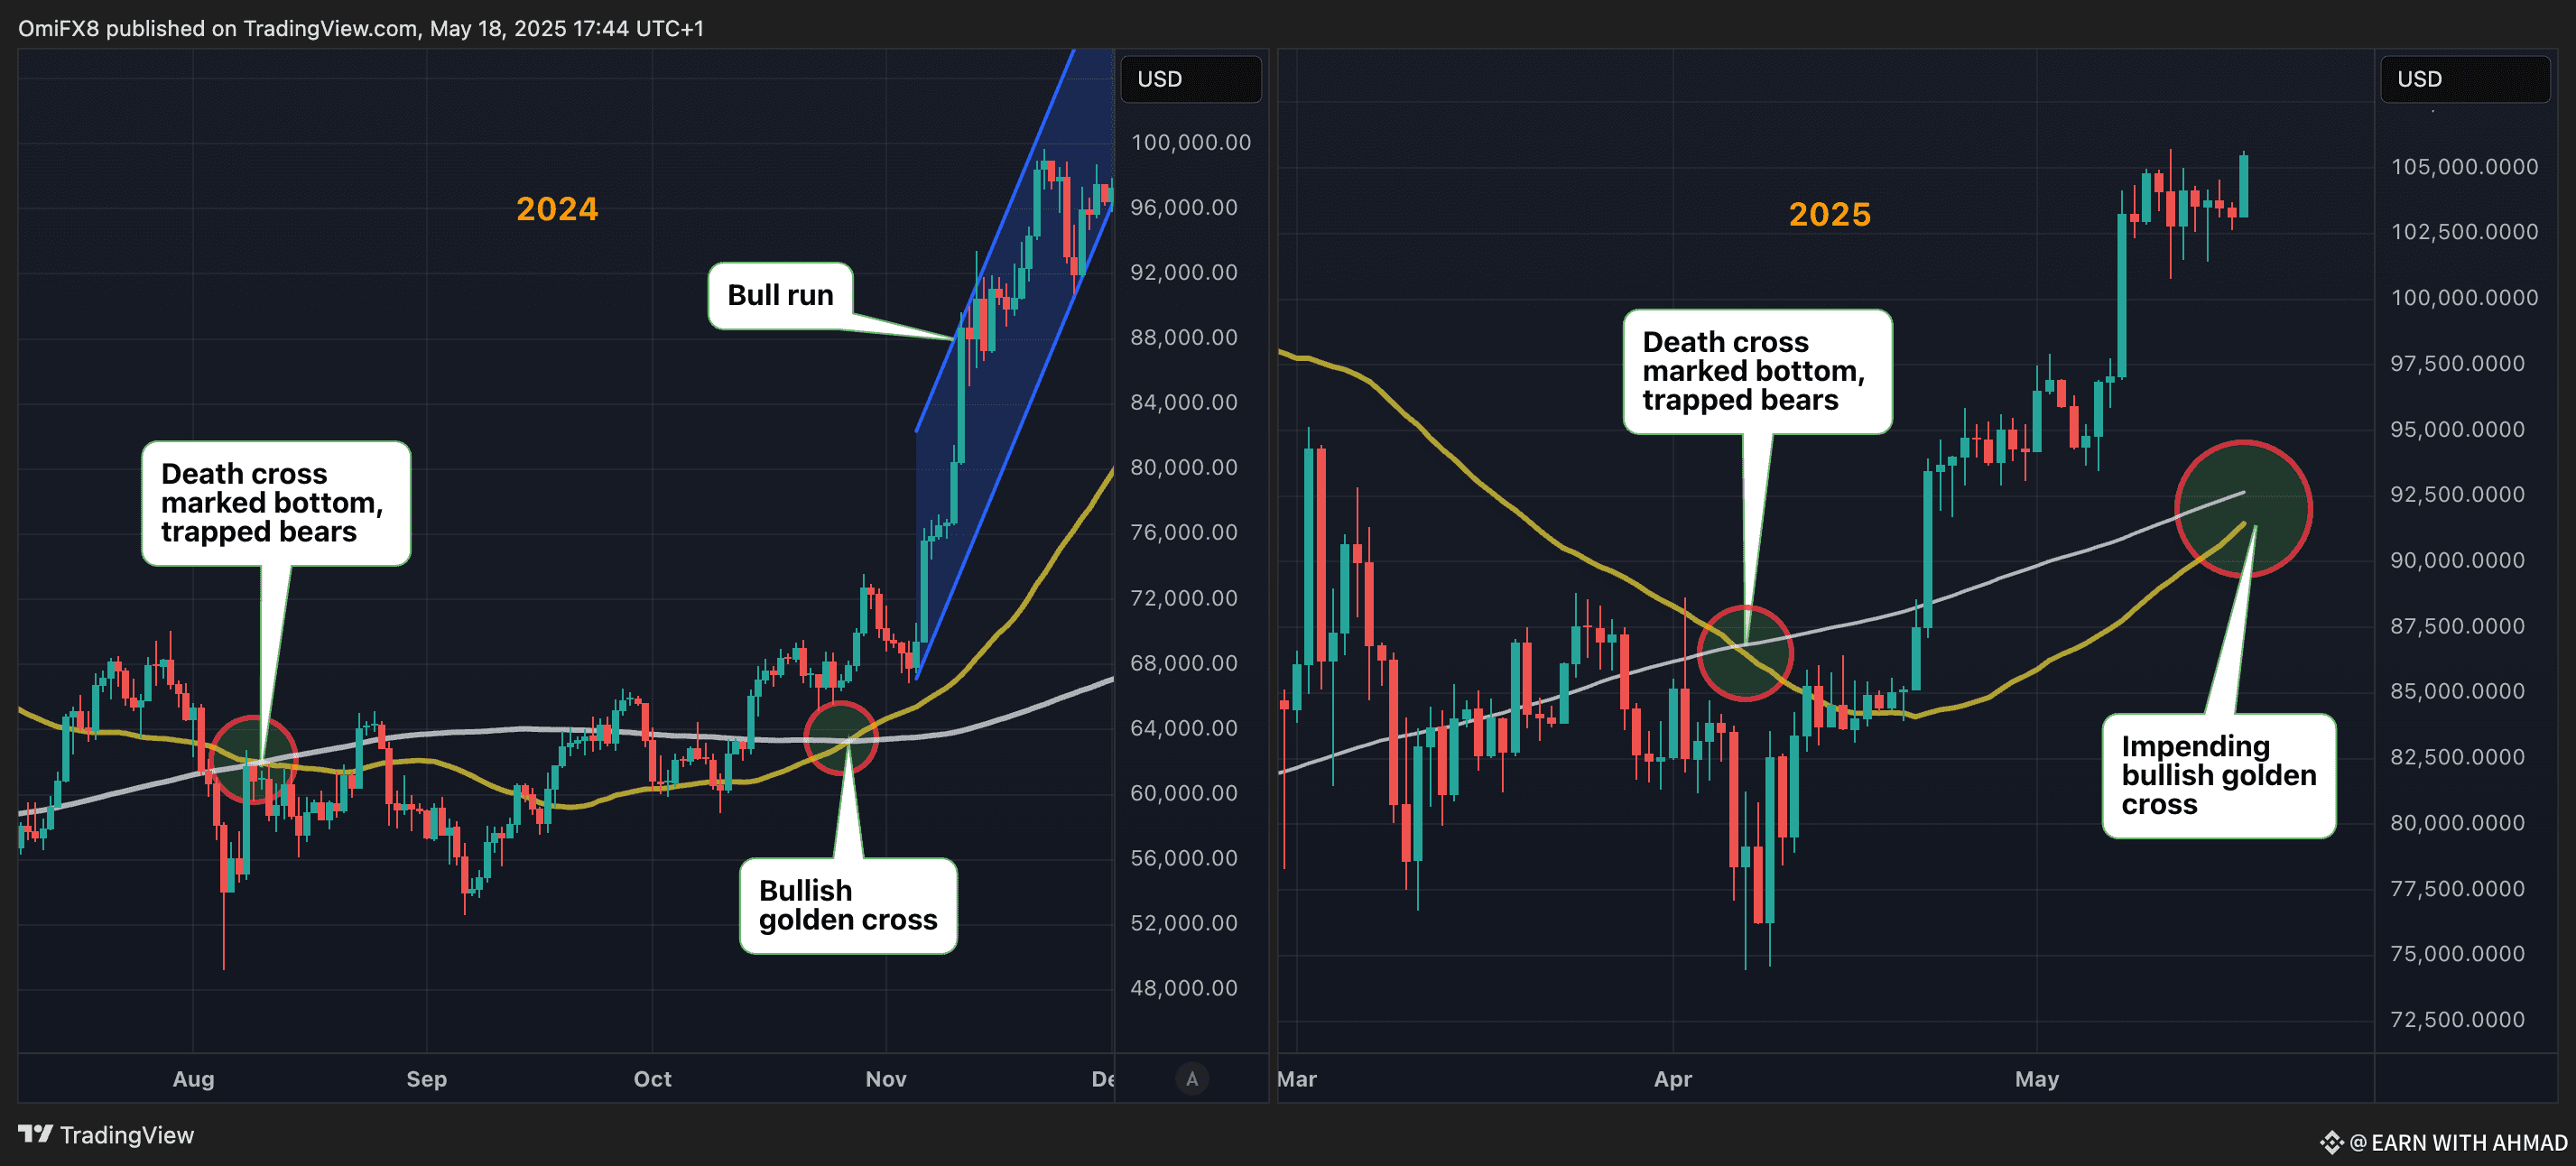
The chart on the left shows that BTC bottomed out at around $50,000 in early August last year as the 50-day SMA moved below the 200-day SMA to confirm the death cross.
In other words, the death cross was a bear trap, much like the one in early April this year. Prices turned higher in subsequent weeks, eventually beginning a new uptrend after the appearance of the golden cross in late October 2024.
The bullish sequence is being repeated since early April, and prices could begin the next leg higher following the confirmation of the golden cross in the coming days.
Past performance does not guarantee future results, and technical patterns do not always deliver as expected. That said, macro factors seem aligned with the bullish technical setup.
Meanwhile, growing concerns over the ballooning U.S. national debt are fueling interest in alternative assets like Bitcoin. As confidence in traditional financial systems wavers, more investors are turning to BTC as a hedge against inflation and fiscal instability.
With technicals aligning and macro pressures building, Bitcoin’s next move could be explosive. Keep an eye on the charts — the golden cross could be the spark that reignites the bull run.$BTC
#SaylorBTCPurchase #BinancePizza #MastercardStablecoinCards #BinanceAlpha$1.7MReward