In the world of investment, every market fluctuation contains opportunities and challenges.
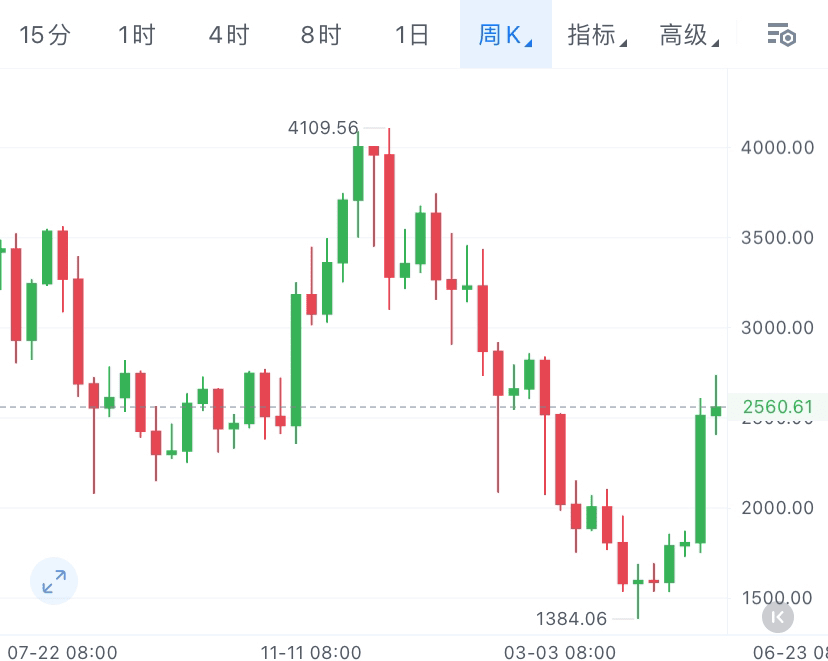
Yesterday, in our analysis of the second contract's trend, we mentioned that its weekly K-line is on the edge of a breakdown, strongly suppressed by MA30. However, the market's trends are always full of variables. Although yesterday's deep retracement made many investors nervous, from a longer time dimension, this is actually a healthy adjustment.
Long-term trend: still bullish
From the weekly K-line, the price of the second contract has stabilized above 2400. Although there was a deep retracement yesterday, this does not mean a change in trend. On the contrary, this is a reflection of market sentiment adjusting. From a long-term perspective, the long-term trend of the second contract remains bullish. This retracement actually provides investors with a better entry opportunity.
Intraday trend: opportunities during the retracement
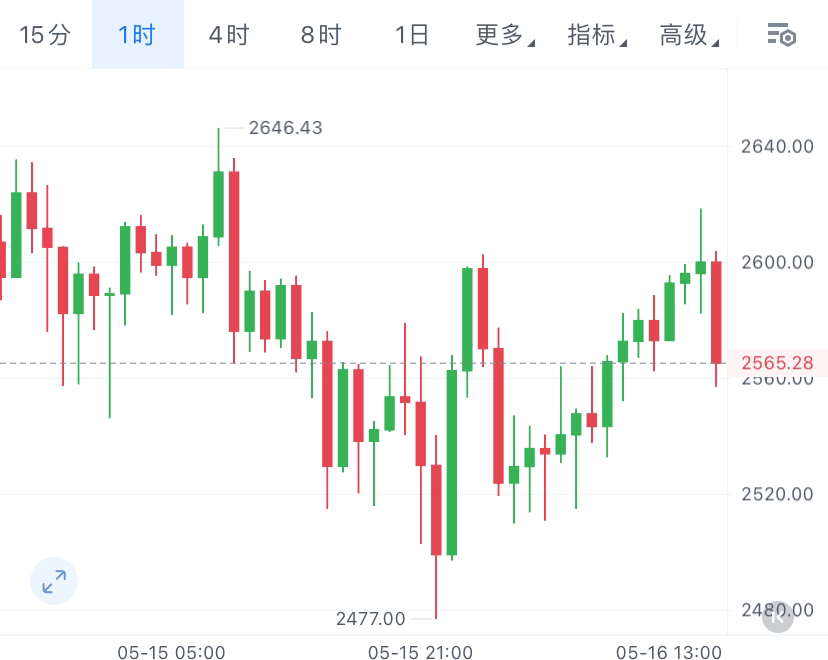
Next, we focus on the intraday trend. From the hourly chart, the previous upward range was 2406-2738. Using the Fibonacci retracement indicator, we can clearly see that the price has repeatedly tested the 61.8% retracement level before moving downward. Although there was a minor breakdown during this period, it was mostly downward shadow tests without any effective break, showing an overall oscillating trend. This kind of trend indicates that there is still strong support during the retracement process.
Further observing the thirty-minute line, the range of 2738-2477 is a recent deep retracement range. Through the Fibonacci retracement line, we can see the extreme pull during the trend process. Every breakout is followed by a small retracement, which further verifies our previous judgment: this is a healthy retracement, not a change in trend. A retracement did not break down, continued downward; a second retracement did not break down, continued downward, until it strongly rose after reaching the 2477 position. Therefore, in the short term, 2477 is a bottom position.
Short-term layout: patiently wait for the retracement
In the case of a short-term bottom, after the price breaks through the 38.2% retracement level, the target will naturally look towards 61.8%. However, the current real-time position has not been able to break through in one go, which means the price needs to adjust. So, how should we layout for the day?
From the fifteen-minute timeline, the RSI indicator has moved down from the overbought position to a stable position, indicating that the trend will adjust downward and will break through after stabilizing at the current position. Therefore, shorting in the short term is inappropriate, as it is difficult to see a deep retracement at this position. Our strategy should be to patiently wait for the price to retrace to a low before entering long, with a target at the 2640 position.
Summary: Seize the opportunities during the retracement
The investment market is always full of uncertainty, but through technical analysis and understanding market sentiment, we can find opportunities within. Although yesterday's retracement made many investors nervous, from a long-term perspective, this is a healthy adjustment. The intraday trend also shows the price support during the retracement, providing us with an entry opportunity.
When entering the market, it is essential to remain patient and wait for clear trend signals. Do not rush to enter, otherwise, you may miss better opportunities. I hope today’s analysis can help everyone. If you have any questions, feel free to communicate with me.
Finally, don’t forget to pay attention to 'Gu Zhi's Trend', see you next time!