Key Factors Behind the Surge
Market Momentum: The price breakthrough comes after weeks of consolidation around the $2,400 to $2,500 range, with ETH finally piercing through key resistance levels.
Institutional Interest: Increased attention from institutional investors has contributed to the upward pressure on ETH's price.
Technical Indicators: The ongoing rally has produced four consecutive bullish candles over the past five days, contributing to a nearly 45% price increase.
Market Outlook
Analysts suggest that if Ethereum maintains its momentum and breaks through the next resistance levels, it could target the $3,000 mark in the near term. However, investors should remain cautious and monitor market developments closely.
Visual Overview
Here are some images illustrating Ethereum's recent performance:
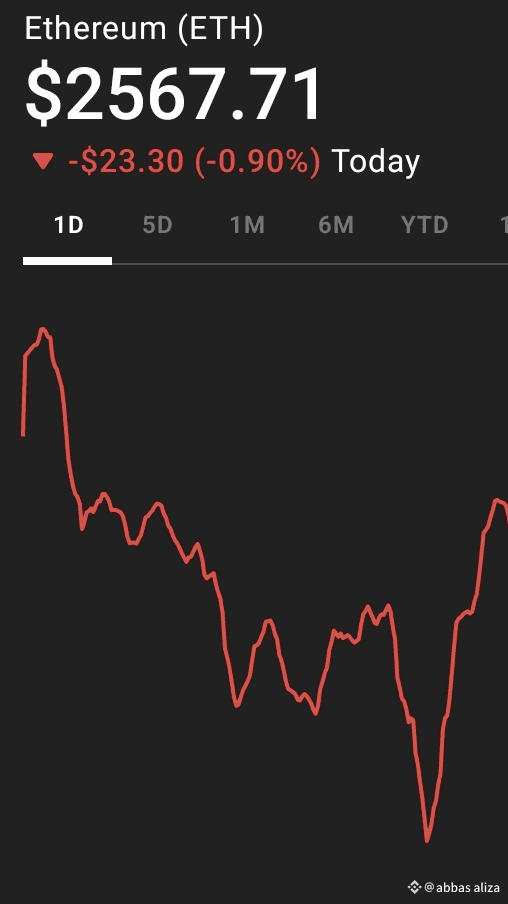
Ethereum Price Chart
A chart depicting Ethereum's price movement in May 2025, highlighting the recent surge above $2,600.
29
**Ethereum Price Chart**
1094-3A chart depicting Ethereum's price movement in May 2025, highlighting the recent surge above $2,600. 33Market Sentiment
An infographic showing the bullish sentiment among investors contributing to Ethereum's price increase.
34
**Market Sentiment**
1384-1An infographic showing the bullish sentiment among investors contributing to Ethereum's price increase. 38Trading Volume
A graph illustrating the spike in Ethereum's trading volume coinciding with the price surge.
39
**Trading Volume**
1590-1A graph illustrating the spike in Ethereum's trading volume coinciding with the price surge. 43
---
*Note: Cryptocurrency markets are highly volatile. It's essential to conduct thorough research and consider risk factors
before making investment decisions.*