In the past month, Ethereum [ETH] has risen 55.17%, making it one of the assets with the largest increases among the top 10 by market cap.
At the time of writing, buying pressure is easing as investors may be taking profits, resulting in a price drop of 2.47%.
This downward trend may be temporary, as market analysis suggests that this is just a slight adjustment phase before another significant rise—this time to $5,000.
AMBCrypto analyzed the key factors that could drive ETH's rise.
Does this positive recovery mean the green light is on?
The market value to realized value (MVRV) ratio has entered a positive momentum on the chart, indicating that buyers are stepping in.

The positive momentum area is marked by the period on the chart turning blue after exiting the negative momentum phase (marked in red).
This phase on the chart typically foreshadows the beginning of future price increases. In the past 24 hours, ETH has only seen a slight decline, showing potential for the next upward round to begin.

MVRV deviation price bands help identify key support and resistance levels on the chart, indicating that ETH could freely rise to $3,100.
Another key factor that could drive the market's continued rise is the liquidity inflow from traditional investors.
These market participants, known for large transactions, will inject liquidity into ETH through exchange-traded funds (ETFs).
Traditional financial participants are also returning. As of the time of publication, the value of ETH's spot ETFs has reached $9.5 billion.
Any growth indicates an increase in investor activity and new liquidity inflows.
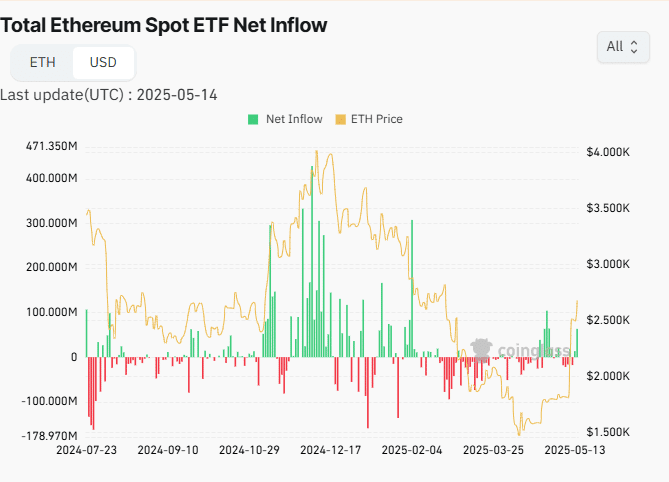
Additionally, over the past two days, the daily net inflow for ETH reached $77 million. Continued inflows will provide strong support for ETH's rise again.
Rotation from Bitcoin to ETH
A key factor for ETH potentially reaching $5,000 is its ability to attract more liquidity than BTC.
This trend has already begun, as the ETH/BTC chart surged over the past eight days, reaching a high of 41%, with a trading volume of 493,960 ETH.

According to the pattern shown on the chart, liquidity flowing into ETH may exceed that flowing into Bitcoin in the coming trading days, which could further support its rise.
Is this a free run?
Despite the optimism remaining high and the trend of liquidity inflows still present, ETH may still face significant obstacles on its path to rising.
The chart identifies three key resistance levels that could have this impact: $2,756.30, $3,389.86, and $4,093.57.

ETH is currently testing the first resistance level. If it breaks through, its momentum will be sufficient to drive it further up.
Currently, the overall market sentiment supports ETH rising to $5,000 and potentially reaching an all-time high.