
"Gazing into the endless frontier of technology; insight into the future, leading a new era of investment research." This report is provided by the "WTR" Research Institute:Members' Twitter IDs: Golden Egg Diary @jindanriji; Elk will not get lost @crypto_elk_; Forex Brother; Xibei @Asterismone;
The first round of WTR on-chain data subscriptions (OG) has officially opened!Data provided: WTR self-developed on-chain data for short-term, medium-term, and long-term markets, along with some small coin data. First-round pricing: 399U/year. Payment supports on-chain and off-chain transfers. Other notes: We have prepared a strategy package for OG users, with limited slots available, currently only open to first-round OG users. Subscriptions can be made by directly adding OG user groups; for details, please see X.

This week in review
From May 5th to May 12th this week, ice sugar orange reached a high near $105,819 and a low close to $93,514, with a fluctuation of about 13.16%.
Observing the chip distribution map, there are a large number of chips traded around 93,000, which will provide certain support or pressure.

Analysis:
60000-68000 about 1.22 million coins;
76000-89000 about 1.1094 million coins;
90000-100000 about 1.57 million coins;
The probability of not breaking below 95000~100000 in the short term is 80%;
Important news aspect
Economic news aspect
International trade and tariffs:
US-UK tariff agreement: Last week, the U.S. and the U.K. reached a tariff agreement.
Geneva trade talks (China-U.S. consensus): Important consensus was reached in the Geneva trade talks this week between China and the U.S. Further attention is on tariff agreements between the U.S. and economies like Japan and South Korea. The market is recovering from the declines caused by previous tariff negatives.
Progress of the Geneva talks (news from the 12th): Important consensus was reached between the two trade sides, achieving substantial progress. 10% of tariffs are retained, while other additional tariffs are canceled or suspended. This positive outcome brings stabilizing signals to the market, stabilizing the international trade environment, reducing global asset market risk aversion, and positively impacting economic prospects. The U.S. side stated that the differences were not large, and the agreement was reached quickly.
Trump's attitude softening (mentioned): "After Trump's attitude softened," the market is recovering from its declines. Looking forward to transitioning from "the window period of Trump's tariff softening."
Federal Reserve Policy:
The reduction of the Federal Reserve's balance sheet is slowing: The Fed's balance sheet decreased by $17 billion last month to $6.7 trillion (the lowest since April 2020). In March, it announced a slowdown in quantitative tightening (QT) from $60 billion per month to $40 billion, indicating a slowdown in the rate of reduction.
Rate cut expectations: Inflation data (CPI) will directly affect the month of the Federal Reserve's rate cuts. It is expected that U.S. QT will soon end and rate cuts will begin. The market expects that the declines caused by the previous pause in rate cuts may be recovered in the summer.
Inflation data:
U.S. CPI release: The U.S. will release CPI data on Tuesday, with the previous value at 2.4% and the expected value at 2.4%.
On the news front of the crypto ecosystem
SEC dynamics and regulation:
Tokenization roundtable: The SEC held a roundtable on the 12th themed 'Tokenization: Moving Assets Onchain: Where TradFi and DeFi Meet.' Participants included the SEC director, the head of the crypto working group, Commissioner Hester Peirce, and representatives from institutions like Fidelity, Nasdaq, Invesco (Will Geyer), etc.
BlackRock meets with the SEC (ETH ETF): BlackRock met with the SEC last Friday to discuss the staking and options issues of crypto ETFs.
Expectations for the new SEC director: The market expects that the new SEC director may bring breakthroughs in tokenization and staking legislation.
U.S. government holdings:
Arkham data shows that the value of the U.S. government's cryptocurrency holdings has risen to $21.156 billion, including:
198,012 BTC (worth about $20.69 billion)
59,965 ETH (worth about $150.7 million)
12.2 million USD in stablecoins
Analyst opinions and market predictions:
Moustache: The current market structure is similar to those in 2016 and 2020, and the altcoin season of 2025 has officially begun.
Hank Huang (CEO of Kronos Research): The crypto market rebounds on global optimism, with ETH's strong rebound driving the altcoin market. Whether capital can effectively rotate from BTC to altcoins and the participation of retail investors are key observation points.
Min Jung (Presto research analyst): The recent market rise is driven by optimistic sentiment from trade negotiations. The possibility of BTC breaking through historical highs depends on the development of the negotiations. BTC's dominance has returned to the level before the bull market of 2021 and is undergoing typical rotation, with capital flowing into altcoins.
Rekt Fencer: Sarcastically referring to the altcoin season, believes that the recent rebound of about 10% is easily overinterpreted, with BTC's dominance still above 54% and other key thresholds, and institutions' preference for BTC may continue to influence capital flows.
Rekt Capital: BTC is on the verge of entering the second round of price discovery upward trend, needing to hold the support at $104,500 and to stand at the upper edge of the recent accumulation range is very critical.
Josh Gilbert (eToro analyst): The market is shifting towards a risk preference, with easing tensions. Mentioning 'Trump is willing to negotiate' helps boost the sentiment for risk assets (especially BTC). The market rekindles optimistic sentiment.
Trend Research: Predictions suggest that ETH will reach $5,000 in this cycle, based on the end of U.S. QT and rate cuts, breakthroughs in tokenization and staking legislation brought by the new SEC director, and innovations from the ETH Foundation. In optimistic scenarios, if BTC breaks $300,000, ETH is expected to rise to $10,000.
U.S. BTC spot ETF capital flow:
A net inflow of $920 million last week (BlackRock IBIT inflow of $1.03 billion, Fidelity FBTC inflow of $62.4 million, Grayscale GBTC outflow of $171.5 million).
As of last Friday, the cumulative net inflow was $40.806 billion, a historical high, with $5.3 billion attracted in the past three weeks, and the holding volume surpassing 4.9 million BTC.
U.S. spot ETH ETF capital flow: A net outflow of $38.2 million last week.
BlackRock ETH ETF application: BlackRock submitted an application allowing its ETH ETF to conduct physical redemptions, supporting direct repurchases of ETH.
ETH performance:
Last week, it rose by 37.01%, marking the highest historical increase for ETH in the 18th week, surpassing 33.1% in the same period in 2021.
Institutional purchasing:
MicroStrategy (Strategy): Increased holdings by 13,390 BTC from May 5 to 11, with an average price of $99,856 (totaling $1.34 billion).
Coinbase (Cb): Increased holdings of $153 million in cryptocurrencies in the first quarter, holding crypto assets valued at $1.3 billion as of the report date, most of which are BTC.
Long-term insights: Used to observe our long-term situation; bull market/bear market/structural changes/neutral state
Medium-term exploration: used to analyze what stage we are currently in, how long this stage will last, and what situations will be faced.
Short-term observation: used to analyze short-term market conditions; and the likelihood of certain events occurring under certain premises.
Long-term insights
Illiquid long-term whales
BTC U.S. spot ETF capital flow
Large inflow and outflow net position on exchanges
BTC total selling pressure risk ratio
(Below figure illiquid long-term whales)

This ratio has remained high recently and has shown a further upward trend in the latest data.
This indicates that BTC held for the long term and not easily sold (illiquid supply) is still increasing, or its growth rate exceeds the overall supply growth. This is usually seen as a positive signal, representing strong confidence among whale HODLers and lower potential selling pressure.
Historical comparison: Historically, this indicator's sustained rise often accompanies price increases or builds momentum for increases.
BTC prices and increases in illiquid supply rise in sync, indicating healthy support.
(Below figure BTC U.S. spot ETF capital flow)

After experiencing a period of slowed capital inflow or even a brief outflow, recent days (on the far right) show a clear recovery of net inflow.
Although daily inflow may not match the peak when the ETF was just launched, the continued net inflow indicates that traditional financial markets are still actively allocating BTC.
Historical comparison: The significant inflow at the beginning of 2025 was an important driver of this market cycle. The recent recovery inflow has supported and driven market confidence and prices.
(Below figure large inflow and outflow net position on exchanges)

Red bar (>10 million USD): After prices rose to high levels, some intermittent net inflows occurred (large holders may be cashing out or managing risks), but there has not been a sustained large-scale outflow to exchanges. In recent days, there has even been a slight net outflow (red negative value).
Orange bar (1-10 million USD): Performance is more mixed, but overall, during the price increase process, there has not been a sustained large-scale net inflow. In recent days, there has also been a net outflow.
Overall:
Although there are signs of some large holders cashing out at high levels, there has not been a trend of panic selling or large-scale transfers of BTC into exchanges in preparation for sale. Instead, in recent days, large addresses have shown signs of net outflows from exchanges, which is usually interpreted as accumulation or transfer to long-term storage, a positive signal.
(Below figure BTC total selling pressure risk ratio)

This ratio is currently at a relatively medium-low position. It is neither at an extremely low 'excellent buying zone' nor has it reached the high-risk areas seen at historical bull market tops. During the recent price increase, this indicator has risen, but the increase is moderate.
Historical comparison: Before the significant price increase at the end of 2023 to the beginning of 2024, this indicator was at a low level. At historical bull tops, this indicator would be very high.
Currently, prices are rising, and the seller risk ratio is rising moderately, consistent with the characteristics of a healthy bull market, indicating that the market has not accumulated excessive short-term profit selling pressure due to rapid price increases.
Reanalyzing combining macro and on-chain logic:
Starting point: Macroeconomic improvement + ETF narrative drive (news and Figure 2)
News: Federal Reserve QT slowdown, rate cut expectations, easing trade tensions ➔ Market risk appetite increases.
Figure 2 (ETF): The strong capital inflow to ETFs at the beginning of the year validated the demand for traditional capital allocation to BTC, which is a cornerstone of this market cycle. The recent re-inflow of ETF funds injects new energy and confidence into the market.
Analysis: Macroeconomic tailwinds + structural demand (ETF) together construct the foundation for the bull market.
Support: Increased HODLer confidence and tightening supply (Figure 1)
Figure 1 (Illiquid long-term whales): Against the backdrop of rising prices and continuous accumulation of ETFs, illiquid supply continues to increase, indicating that long-term investors (HODLers) are not only not selling off due to price increases but are instead reluctant to sell and are even increasing their holdings. This has resulted in a tightening of the actual tradable supply.
News: Institutions like MicroStrategy continue to increase their BTC holdings, consistent with the trend of increasing illiquid supply.
Thus: Strong HODLing behavior + continuous ETF purchases ➔ Further reduction in the BTC available for trading in the market ➔ Supply shock effects emerge, providing strong support for prices.
Verification: Large holder behavior and market risk assessment (Figures 3 and 4)
Figure 3 (Large exchange net outflows): Despite high prices, large addresses have shown a trend of net outflows from exchanges recently, indicating that whales/institutions are still accumulating or transferring BTC into cold wallets for long-term holding rather than massive sell-offs. This further reinforces expectations of supply shortages.
Figure 4 (Total selling pressure risk ratio): At a moderately low level, showing that the market is not overheated, and the current upward trend has a certain level of health and is not purely driven by short-term speculation.
Figure 1 (Illiquid long-term whales): Also shows that the market is far from reaching a frenzied top.
News: Analysts believe that BTC is on the verge of entering the second round of price discovery, needing to hold key support (such as $104,500). On-chain data shows the solidity of this support.
Thus: The accumulation behavior of large holders and controllable market risks provide space and possibility for further price increases. The market structure is relatively healthy.
Progressively speaking: rotation expectations and new catalysts (news)
News: The market is focused on the progress of the ETH ETF and the possibility of capital rotating from BTC to altcoins. The decline in BTC's market share is seen as one of the signals of the altcoin season.
On-chain correlation: If BTC continues to be strong and attracts more capital, when its price stabilizes or the rate of increase slows down, some funds seeking higher alpha may flow into ETH and other altcoins. This may be reflected in BTC-related on-chain indicators (such as the slowing growth of illiquid long-term whales or increased short-term capital activity on exchanges), but currently, BTC's fundamentals remain very strong.
Overall: Currently, BTC remains the absolute leader in the market. If macro and ETF capital flows continue to improve, BTC is expected to continue leading. Clear progress on the ETH ETF will be the next important market catalyst and observation point.
Future outlook:
Short to medium-term outlook:
High probability of BTC maintaining strength: Given the strong growth of illiquid long-term whales, the reinvestment of ETF funds, signs of accumulation among large holders, and the not overly hot total selling pressure risk indicators, BTC prices are expected to continue to fluctuate upwards and may even challenge previous highs. The support mentioned in the news at $104,500, if maintained, will be an important signal.
Focus on the sustainability of ETF capital flows: Whether ETF funds can maintain stable net inflows (as shown in the recent trend in Figure 2) is crucial. If there is sustained large-scale net outflow, caution against correction risks is needed.
Impact of macro data: CPI, Federal Reserve meetings, and other macro events will still bring market volatility. Inflation data and dovish signals that meet expectations will further boost the market.
ETH ETF progress: Any substantial positive news regarding the ETH ETF could ignite market enthusiasm for ETH and related ecosystems, potentially diverting some short-term capital attention from BTC, but in the long run, it is positive for the entire crypto market.
Medium to long-term outlook:
Deepening bull market phase: Current on-chain data characteristics (high illiquidity, long-term whales in the early stages of rising, controllable risks) align with the characteristics of a bull market transitioning from early to mid-stage. If the macro environment continues to improve (such as the Federal Reserve starting a rate-cutting cycle), combined with the continuous penetration of compliant channels like ETFs, the bull market may deepen further.
Price discovery and increased volatility: As prices continuously reach new highs, market volatility may increase. Close attention should be paid to the illiquid long-term whales in Figure 1 and the spot total selling pressure risk ratio in Figure 4; if they rapidly approach historical top regions, market risk will sharply rise, necessitating caution against potential short-term peaks or deep corrections.
Long-term impact of tokenization and regulation: The SEC's focus on tokenization and potential policy breakthroughs from the new director mentioned in news is a long-term positive. If compliance and scaling of asset tokenization can be achieved, it will open up tremendous incremental space for the cryptocurrency market.
Arrival of altcoin season: When BTC's upward momentum slows or enters high-level consolidation, and the benefits of ETH ETFs are realized, the likelihood of a large-scale rotation of funds into altcoins' 'altcoin season' will increase. At that time, BTC's market share will be an important observation indicator.
Medium-term exploration
Liquidity supply volume
Cost structure at various price levels
USDC purchasing power composite score
Whale composite score
Incremental model
Liquidation structure
(Below figure liquidity supply)

From the current situation, liquidity supply is deteriorating and decreasing. The recent market increase may belong to a low-volume trend, which is not sustainable in a stock environment.
(Below figure cost structure at various price levels)
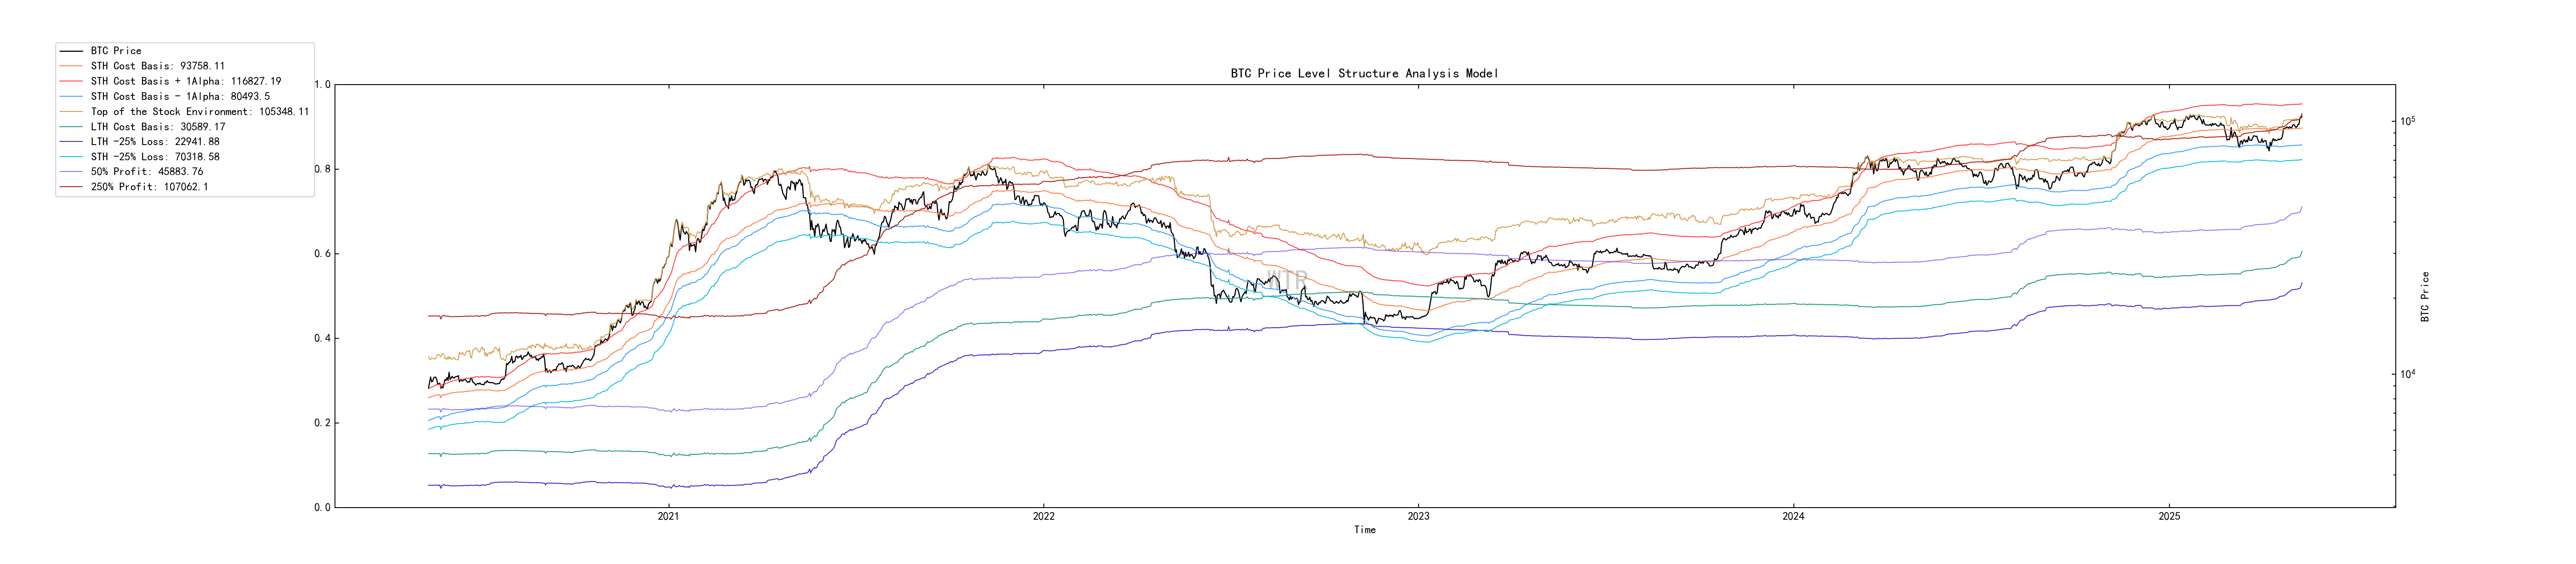
The market's stock top faces a stock limit dilemma around 105000.
If there is no significant incremental supply in the future, it may top out at this price level.
At the same time, if the market remains a stock structure, it may undergo high-intensity fluctuations within the range of 80000-105000.
Of course, the current range given is a rough estimate of the price level range that market liquidity can support.
If the market experiences an incremental trend, emotional squeeze corrections, or deep liquidation of leverage, it may break this range.
(Below figure USDC purchasing power composite score)

Currently, USDC funds still have high purchasing power, and the market may still have residual liquidity supporting market pricing in the short term.
(Below figure whale composite score)

Whales' purchasing power remains at a high level, and the current market situation has not shown a significant shake-up of whales as a whole, nor signs of divergence.
(Below figure incremental model)

The current supply of incremental funds is not sufficient, which may require market growth, or the current incremental funds do not have the intention to chase prices excessively.
(Below figure liquidation structure)

The market is switching from a short liquidation structure to a long liquidation structure.
If the market lacks incremental capital supply, there may be significant volatility in the coming period.
Short-term observation
Derivatives risk coefficient
Options intention trading ratio
Derivatives trading volume
Implied volatility of options
Profit and loss transfer volume
New addresses and active addresses
Ice sugar orange exchange net position
Auntie trading exchange net position
High-weight selling pressure
Global purchasing power status
Stablecoin exchange net position
Off-chain exchange data
Derivatives rating: The risk coefficient is in the red zone, indicating high derivatives risk.
(Below figure derivatives risk coefficient)
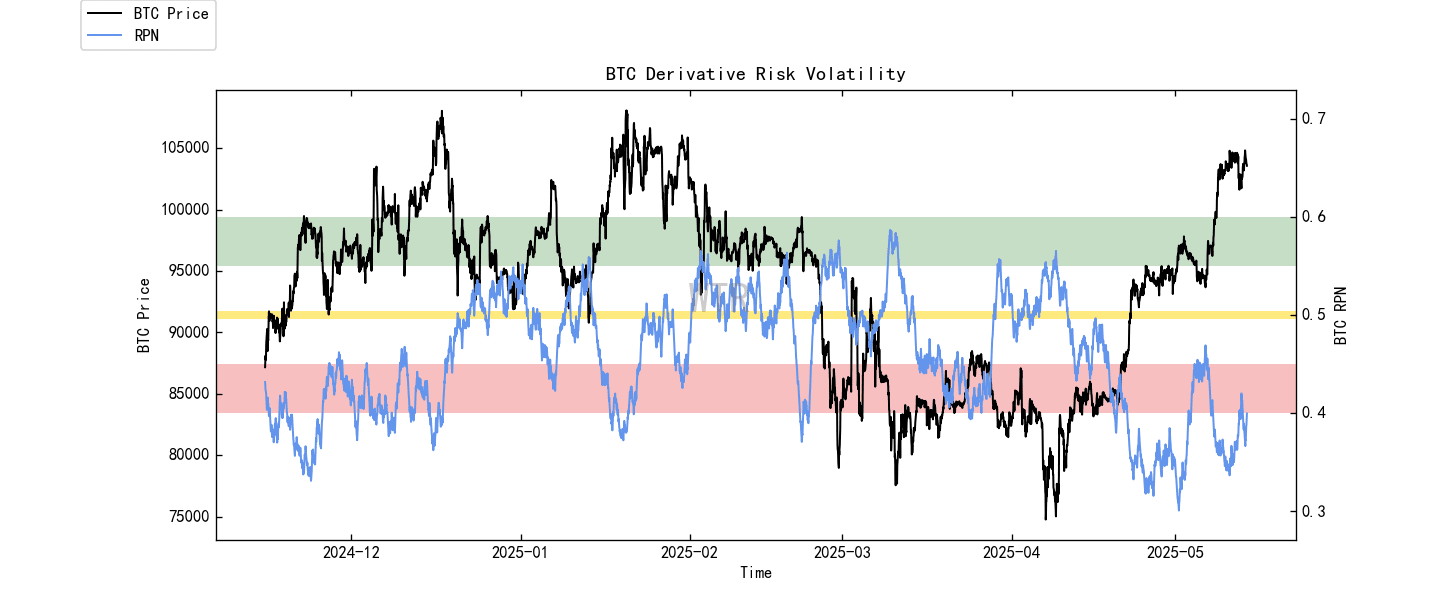
The risk coefficient has entered the red zone again due to the continued short squeeze in the market, but the intensity of the squeeze has slightly decreased compared to last week.
(Below figure options intention trading ratio)

The ratio of put options has slightly increased, with trading volume flat compared to last week.
(Below figure derivatives trading volume)

Derivatives trading volume is at the median.
(Below figure implied volatility of options)

Short-term implied volatility for options only has low amplitude fluctuations.
Sentiment state rating: Neutral
(Below figure profit and loss transfer volume)

Although the market is undergoing continuous short squeezes, the market's sentiment itself has not continued to rise into a frenzy.
(Below figure new addresses and active addresses)

New active addresses are at the median.
Spot and selling pressure structure rating: BTC and ETH are in a continuous state of large outflows.
(Below figure ice sugar orange exchange net position)

Currently, BTC continues to see large outflows.
(Below figure E-tai exchange net position)

Currently, ETH continues to see large outflows.
(Below figure high-weight selling pressure)

There is a slight amount of high-weight selling pressure, but it has currently eased.
Purchasing power rating: Global purchasing power has significantly rebounded, and the purchasing power of stablecoins is basically flat compared to last week.
(Below figure global purchasing power status)

Global purchasing power has significantly rebounded.
(Below figure USDT exchange net position)

The overall purchasing power of stablecoins remains flat compared to last week.
Off-chain trading data rating: This week's data website malfunction, no off-chain trading data available.
This week’s summary:

News analysis and summary:
Short-term:
CPI data is key:
If inflation data continues to be moderate or declines, it will solidify expectations of Federal Reserve rate cuts, favoring risk assets, and the crypto market is expected to continue its upward trend. Conversely, it may bring short-term correction pressure.
BTC may continue to fluctuate upwards, but volatility may increase:
After the market digests existing ETF benefits, new large-scale incremental funds may need to wait for clearer macro signals (such as the first rate cut). $104,500 is an important observation point.
ETH ETF news will dominate the sentiment of ETH and some altcoins:
Any positive or negative news regarding the ETH ETF could trigger significant market volatility. BlackRock's actions deserve close attention.
Medium-term:
"Summer window period" is the core focus:
The market generally expects that summer may usher in a substantive shift in Federal Reserve policy (such as a clear rate-cutting path) and further clarification of tariff policies. If both are favorable, it will provide strong macro support for the crypto market.
Fate of the ETH ETF:
If approved, it is expected to drive ETH and related altcoins to experience independent market trends, forming a situation of 'BTC staging, ETH performing, and altcoins celebrating.' The target of $5,000 for ETH is not out of reach under optimistic sentiment.
Whether capital rotation is smooth:
Whether BTC's dominance will continue to decline and whether funds will flow into altcoins on a large scale as expected are key factors determining whether the altcoin season can fully explode. Caution is needed against 'false breakouts' and the aftermath of some hot speculation.
Long-term:
Potential of tokenization and asset on-chain:
The SEC's roundtable is just the beginning. If a favorable regulatory framework can be formed, the tokenization of traditional assets will bring trillion-level incremental space to the crypto market.
The trend of institutions continuously entering remains unchanged:
Although the pace may slow down in phases, the trend of traditional financial institutions allocating cryptocurrency assets (especially BTC and ETH) is expected to continue.
Clarification of regulations is one of the biggest driving forces:
Clear regulation will reduce uncertainty, attract more conservative capital, and promote industry innovation.
In summary:
Current market sentiment is relatively optimistic, mainly driven by macro expectations improvement and BTC ETF successfully attracting capital.
ETH ETF is the core narrative going forward.
However, market volatility remains high and depends on the fulfillment of multiple conditions (such as CPI data, actual actions by the Federal Reserve, ETF approvals, etc.).
Need to remain rational, cautious of 'overinterpretation' of short-term rebounds, and focus on key changes in capital flows and market structure, especially regarding altcoin selections, where the importance of fundamentals and narratives will become more pronounced.
On-chain long-term insights:
Macroeconomic improvement + structural demand for ETFs ➔ Increased confidence among whale HODLers;
Continuing illiquid supply raises prices ➔ Large holders accumulate, market selling pressure is controllable;
Risk indicators are healthy ➔ BTC price has a basis for sustained upward movement ➔ (in the future) ETH ETF and other new catalysts are expected to follow ➔ Bull market develops in depth;
Need to be alert to the rapid rise of on-chain risk data in the mid to late stages.
Market tone:
Currently, various on-chain indicators and news points to a positive market environment, with BTC's role as the leader still solid.
Currently, the ability of the positive trend to sustain is crucial, whether on-chain, macro, and regulatory levels can continuously release positive signals.
On-chain medium-term exploration:
Liquidity deterioration, difficult to sustain low-volume increases.
Stock limit around 105000, insufficient increment may trigger range fluctuations.
USDC's short-term purchasing power still supports market pricing.
Whale purchasing power remains unshaken, no divergence is observed.
Insufficient incremental capital supply, lack of momentum for price chasing.
The market has shifted to a long liquidation structure, and the absence of incremental capital may exacerbate volatility.
Market tone:
Key price levels, intense speculation
Around 105000 is the stock top area for BTC.
From the perspective of derivatives, it has entered the final stage of a short liquidation chain.
After the 'short fuel' is exhausted, new funds need to be injected to ensure healthy transactions in BTC, thereby breaking through the stock limit.
If BTC pricing is stuck around 105000, it may lead to a ceiling due to excessive profits on the market without funds to support it.
On-chain short-term observation:
The risk coefficient is in the red zone, indicating high derivatives risk.
New active addresses are relatively at the median.
Market sentiment state rating: Neutral.
Exchange net positions of BTC and ETH are in a continuous state of large outflows.
Global purchasing power has significantly rebounded, and the purchasing power of stablecoins is basically flat compared to last week.
The probability of not breaking below 95000~100000 in the short term is 80%.
Market tone:
Current market sentiment, even in the face of ongoing short squeezes, has not entered the 'frenzy' zone and remains within a neutral range. Comprehensive observation of data shows that the current price level of the short-term market has generated initial divergence, but there is still potential for further short squeezes, with a lower probability of pullbacks.
Risk warning:
The above are all market discussions and explorations and do not constitute directional opinions on investments; please treat them with caution and prevent market black swan risks.
This report is provided by the 'WTR' Research Institute.
Welcome to follow us!
